JCR_Mauveine_ACCEPTED_FINAL_9_6_15
Syntheses and structures of pseudo-mauveine picrate and 3-phenylamino-5-(2methylphenyl)-7-amino-8-methylphenazinium picrate ethanol mono-solvate: the first crystal structures of a mauveine chromophore and a synthetic derivative.
M. John Plater* and William T. A. Harrison, Department of Chemistry, University of
Aberdeen, Meston Walk, Aberdeen, AB24 3UE. m.j.plater@abdn.ac.uk
Henry S. Rzepa, Department of Chemistry, Imperial College, South Kensington Campus,
London SW7 2AZ
Key Words : William Henry Perkin, mauve, mauveine, N -phenylp -phenylenediamine, aniline.
Graphical abstract
M. John Plater,* William T. A. Harrison and Henry S. Rzepa
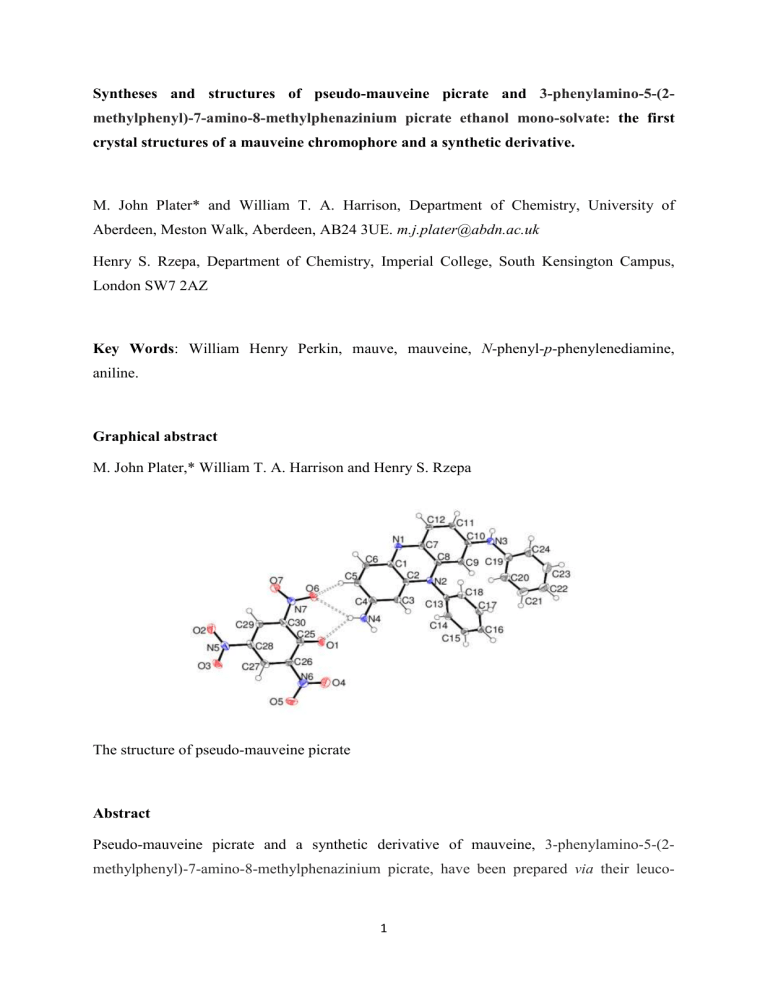
The structure of pseudo-mauveine picrate
Abstract
Pseudo-mauveine picrate and a synthetic derivative of mauveine, 3-phenylamino-5-(2methylphenyl)-7-amino-8-methylphenazinium picrate, have been prepared via their leuco-
1
bases and their crystal structures determined.
Time-dependent density functional theory (TD-
DFT) gives a good match for the calculated and measured UV/VIS spectra.
Introduction
The analysis of mauveine on early dyed garments from the late 19 th century show the presence of pseudo-mauveine as a minor constituent.
1
The aniline oxidised with K
2
Cr
2
O
7
was impure and contained small amounts of o and p -toluidine, which couple together with aniline more efficiently than pure aniline.
2 In contrast, the mauveine known as Schunck’s mauveine and Caro’s mauveine is actually mainly pseudo-mauveine.
3
These were formed by oxidising aniline with CuCl
2
.
4
The aniline used may have been purer and contained less o - or p toluidine so mainly pseudo-mauveine formed. Pseudo-mauveine does not occur in samples of so-called authentic mauveine housed in museums in London, Manchester and New York.
1
Cork and bottle hall-marks with the Perkin & Sons logo suggest these were made in Perkin’s factory by a modified process.
2,5
We investigated this idea and suggested the use of tert butylp -toluidine as a building block in a protection–deprotection sequence to explain the predominance of mauveine A and B rather than mauveine A, B
2
, B and C, which occurs in mauveine made by Perkin’s historical method (the oxidation of a mixture of aniline/ o -
Scheme 1 The structures of pseudo-mauveine 1 and mauveine A 2 , B
2
3 , B 4 and C 5
2
toluidine/ p -toluidine).
2,6–7
The correct skeletal molecular structure of mauveine A itself was only established as recently as 1994 using NMR spectroscopy,
8-9
which corrected previous erroneous structures, and is frequently reviewed
10-19
but this technique left open the issue of confirming the tautomeric distribution of three acidic protons amongst the basic nitrogen atoms.
20 It is remarkable therefore that to date there are no reported crystal structures of these iconic compounds, which played a key role in the development of industrial organic chemistry.
Discussion
(i) Single crystal structure determination of pseudo-mauveine picrate 7 and 3phenylamino-5-(2-methylphenyl)-7-amino-8-methylphenazinium picrate 8
Although the various mauveine chromophores (A, B
2
, B, C, pseudo-mauveine and others) are now regarded as being fully characterised by spectroscopic methods,
21
crystal structures provide not only a definitive proof of the structure but also of the tautomeric proton locations.
They also provide information on electronic structure (in terms of bond-lengths within the ring system) and the molecular conformation in the solid state. Despite mention of crystalline phases by Perkin himself, our attempts to crystallise mauveine chromophores, and some synthetic derivatives
22 met with failure until we began an investigation into the use of picrate as the counter-ion. Picrate salts of aromatic compounds are often crystalline and the method was widely used in the past, but seems to be less fashionable today.
23
The counterion of a mauveine chromophore is easily changed, since treatment of the starting sulphate salt with base in water precipitates the leuco base (not shown) (Scheme 2). The leuco base was filtered off and re-dissolved in a small amount of ethanol. Picric acid is supplied under water, so for safety reasons, a small amount was added with a spatula without drying it out. Upon evaporation, the starting pseudo-mauveine sulphate, 1 , had been transformed to crystalline pseudo-mauveine picrate, 7 , and 3-phenylamino-5-(2-methylphenyl)-7-amino-8-methylphenazinium sulphate 6 gave the corresponding picrate salt 8 (as an ethanol solvate). Product
7 was homogeneous and of good crystallinity. The crystal quality of 8 was poor, but sufficient to obtain its structure. Product 8 is not known to be present in Perkin’s mauve although the large number of minor mauveine chromophores
1
suggests it could still be a minor chromophore and is likely to have relevant structural features.
3
Scheme 2 Formation of picrate salts 7 and 8 of pseudo-mauveine 1 and the homologue 6
The asymmetric unit of 7 contains one pseudo-mauveine (C
24
H
19
N
4
+
) cation and one picrate
(C
6
H
2
N
3
O
7
–
) anion (Figure 1). The pseudo-mauveine C1–C12/N1/N2 fused ring system is almost planar (r.m.s. deviation = 0.034 Å) and subtends dihedral angles of 82.18 (6)
and
63.57 (8)
with the C13–C18 and C19–C24 phenyl groups, respectively, thereby giving the cation an approximate ‘F’ shape. The two protons attached to N4, and the one proton attached to N3, were clearly discernible in difference Fourier maps (both groupings are almost planar) and their positions could be freely refined, which establishes beyond doubt the tautomeric structure of pseudo-mauveine. The shortened C10–N3 and C4–N4 bond lengths of
1.352 (3) and 1.331 (4) Å, respectively suggest significant double-bond character, whereas the C19–N3 bond length of 1.431 (4) Å indicates little if any conjugation with respect to the
C19–C24 ring, which is consistent with its twisting out of the plane of the fused ring system.
Within the fused-ring system, the C–C and C–N bond lengths are broadly consistent with an electronic model in which the resonance forms in Scheme 3 make a significant contribution to the molecular structure, although we should take care not to over-interpret a relatively imprecise crystal structure (Table 1). The picrate anion in 7 shows no unusual features: the dihedral angles between the aromatic ring and the N5 ( para ), N6 and N7 ( ortho ) nitro groups are 5.0 (5)
, 34.6 (2)
and 23.5 (4)
, respectively.
Scheme 3 Three resonance forms of pseudo-mauveine 1
In the extended structure of 7 , the cations and anions are linked by N–H O and bifurcated
N–H (O,O) hydrogen bonds (Table 1) to generate supramolecular layers propagating in the
4
(301) plane (Figure 2). A graph-set analysis of the hydrogen-bond indicates that an impressively large R
8
8
(72) loop involving four cations and four anions is present.
24
A number of weak C–H O interactions are also observed (Table 1). The layers interact by way of aromatic
–
stacking [shortest centroid–centroid separation = 3.655 (2) Å] to generate the three-dimensional structure of 7 .
Figure 1 The molecular structure of 7 showing 50% displacement ellipsoids. The hydrogen bonds are indicated by double-dashed lines.
5
Figure 2: Fragment of a (301) sheet in the crystal of 7 with the hydrogen bonds shown as yellow lines.
Table 1 Selected geometrical data [Å, °] for 7
_____________________________________________________
C1–N1 1.331(3) C1–C6 1.428(4)
C1–C2
C2–C3
C4–N4
C5–C6
1.434(4)
1.379(4)
1.330(4)
1.347(4)
C2–N2
C3–C4
C4–C5
C7–N1
1.379(3)
1.408(4)
1.425(4)
1.342(3)
C7–C8
C8–N2
C10–N3 1.352(3)
C11–C12 1.353(4)
N3–H1n O2 i
N3–H1n O3 i
N4–H2n O4 ii
N4–H3n O1
N4–H3n O6
1.421(4)
1.38 (3)
0.76(3)
0.76(3)
0.92(3)
0.75(3)
0.75(3)
C8–C9
C9–C10
1.383(4)
1.403(4)
C10–C11 1.423(4)
C13–N2 1.453(3)
2.41(3)
2.63(3)
2.25(3)
2.26(3)
2.51(3)
3.061(3)
3.365(3)
3.114(3)
2.865(3)
3.173(3)
145(3)
162(3)
157(3)
138(3)
148(3)
6
C3–H3 O5 ii
C5–H5 O6
C11–H11 O3 i
C18–H18 O7 iii
C20–H20 O1 iv
0.95
0.95
0.95
0.95
0.95
2.50
2.40
2.54
2.52
2.55
3.405(4)
3.195(3)
3.393(3)
3.350(4)
3.456(4)
158
142
149
146
161
___________________________________________________________________________
Symmetry codes: (i) x –½, ½– y , 3/2+ z ; (ii) 1– x , – y , – z ; (iii) x –½ ½– y , ½+ z ; (iv) x , y , 1+ z
As well as a cation–anion pair, the asymmetric unit of 8 also incorporates an ethanol solvent molecule (Figure 3). The fused ring system of the cation is close to planar (r.m.s. deviation =
0.044 Å) and the C13–C18 and C19–C24 phenyl groups subtend dihedral angles of 79.1 (2) and 33.5 (2)
, respectively. The precision of the structure is rather low, but the bond lengths in the fused ring system show broadly similar values to the equivalent data for 7 . The picrate anion in 8 shows normal geometrical parameters, with the N6 ( para ) nitro group having a dihedral angle of 2.3 (6)
with respect to the aromatic ring and the N5 and N7 ( ortho ) nitro groups having dihedral angles of 34 (1)
and 32.4 (7)
, respectively.
The packing in 8 is completely different to 7 and features double chains propagating in [100] linked by N–H O and O–H O hydrogen bonds (Table 2), the latter bond arising from the ethanol solvent molecule (Figure 4), which seems to play an important role in the packing.
Unlike 7 , there are no bifurcated N–H (O,O) bonds in the crystal of 8 . Weak C–H O hydrogen bonds (Table 2) and
–
stacking interactions [shortest centroid–centroid separation = 3.795 (4) Å] occur between the chains.
7
Figure 3 The molecular structure of 8 showing 50% displacement ellipsoids. The hydrogen bonds are indicated by double-dashed lines.
Figure 4 Fragment of a [100] hydrogen bonded chain in the crystal of 8 .
8
Table 2 Hydrogen bonds [Å, °] in 8
___________________________________________________________________________
N3–H1n O6 i 1.07 1.97 3.001(8) 161
N4–H2n O1
N4–H3n O8
0.95
0.96
1.99
1.91
2.893(8)
2.834(8)
158
161
O8–H1o O1 ii
C3–H3 O2
C24–H24 O5 iii
C25–H25b O5 iv
C33–H33c O2 ii
1.06
0.95
0.95
0.99
0.98
1.75
2.39
2.58
2.45
2.60
2.774(7)
3.144(8)
3.228(9)
3.413(9)
3.404(11)
162
136
126
164
140
___________________________________________________________________________
Symmetry codes: (i) 1+ x , y , z ; (ii) – x , 1– y , 1– z ; (iii) ½– x , y –½, ½– z ; (iv) ½+ x , 3/2– y , ½+ z .
(ii) Synthetic routes
The two compounds pseudo-mauveine 1 and the synthetic derivative 6 were made from N phenylp -phenylenediamine 9 (Scheme 4) because it is cheap and readily available (1 Kg
£37) 25,22
Scheme 4 The synthesis of compounds 1 and 6 from N -phenylp -phenylenediamine 9
For complete clarity we prepared pseudo-mauveine by three different methods and checked that the spectroscopic data of the product were the same. The methods were (i) the oxidation of a mixture of N -phenylp -phenylenediamine 9 and aniline with K
2
Cr
2
O
7
;
25
(ii) the oxidation of pure aniline with K
2
Cr
2
O
7
; (iii) the oxidation of pure aniline with CuCl
2
.
26
The spectroscopic properties of the resulting pseudo-mauveine were the same in all three cases.
This shows that the pseudo-mauveine crystallised here will have the same structure as pseudo-mauveine from any of Perkin’s syntheses which used aniline as a building block.
9
Attempts were made to crystallise a number of picrate salts of various synthetic derivatives of mauveine
22
but without success. Safranin picrate was also prepared (Scheme 5) but this, although apparently crystalline, failed to give a satisfactory diffraction pattern.
Scheme 5 The formation of safranin picrate
(iii) Data for N-tert-butylmauveine A 13 and B 14
In our previous work we reported the use of N tert -butylp -toluidine 12 for the selective synthesis of mauveine A and B (Scheme 6).
2,6-7
We did not, however, characterise intermediates 13 and 14 because we had difficulty obtaining satisfactory data. These intermediates have now been separated and characterised by performing six flash chromatography columns on a small batch of material, and collecting fractions in each case.
The
1
H NMR data of N tert -butylmauveine A 13 and B 14 show clear differences, in the relative position and order of the peaks, to the data for mauveine A 2 and B 4 , in the aromatic region, and the presence of a tertiary butyl group in the aliphatic region. This confirms our understanding, from HPLC studies and accurate mass spectrometry, that compounds 13 and
14 were isolated as a mixture of compounds prior to de-protection. Scans of the
1
H NMR aromatic region of mauveine A and B are published for the first time in the supplementary section for comparison. The original
1
H NMR spectrum for compound 1 has been published previously.
26
10
Scheme 6 The preparation of N tert -butylmauveine A 13 and B 14 , then mauveine A 2 and
B 4 .
(iv)
Measured and calculated UV/VIS spectra
With the crystal structure providing data for the sites of protonation and conformation, we decided to characterise the nature of the chromophore responsible for the iconic mauve colour, since this has not hitherto been reported for either pseudo-mauveine 1 or its methyl derivative 6 . Computing quantitatively accurate UV-Visible spectra for compounds with
* transition chromophores is deceptively difficult; a good overview of the issues faced is summarised in recent articles by Grimme.
27-29 A commonly used and widely implemented procedure making use of time-dependent density functional theory (TD-DFT) can be used to provide a semi-quantitative interpretation of the nature of the chromophore. Here we employ it to compute the spectrum of the sulfate salt of pseudo-mauveine 1 and the perturbation that adding methyl groups in 6 has on the spectrum.
The M062X function at the 6-311++G(d,p) basis set level using a CPCM self-consistent reaction field solvation model for ethanol as solvent was employed to fully optimise the geometry.
The continuum solvent model for ethanol was augmented with two explicit ethanol molecules to include the effects of specific hydrogen bonding to the amino groups and a sulfate mono-anion replacing picrate provided further hydrogen bonding to the amino group to create a computed ion-pair. The TD-DFT procedure was then applied at the optimized geometries using the PBE function 30 to calculate the first 100 excited states. This function can be tuned to reproduce observed electronic spectra by adjusting the proportion of Hartree–Fock exchange, 31 which for the mauveine chromophore were set to correspond to 4% HF-exchange and 96% correlation exchange contribution.
The calculated band shape using a peak width at half height of 0.13 eV for the electronic spectrum of pseudo-mauveine 1 using this procedure is shown in Figure 5a. Three different energy-optimised rotamers of the 3-aminophenyl group were investigated (rotamers 1–3) and one (rotamer 4) where the dihedral angle along the C–N bond of the 3-aminophenyl substituent was fixed to the value obtained from the crystal structure (61.4° versus 41.8° for rotamer 1). The difference of ~20° for the latter is probably because the crystal structure conformation is influenced by solid-state packing and the solution phase model may be
11
influenced by hydrogen bonding to explicit solvent molecules not present in the crystal structure. Also included was the free base for comparison, since dilute solutions may also contain contributions from this species. The lowest energy excited state for 1 corresponded to predominantly HOMO-LUMO promotion with a smaller contribution from the HOMO-1, with calculated excitation energies of 2.224, 2.200 and 2.243 eV (557.6, 563.5, 552.7 nm) for the three rotamers, and 2.322 eV (534 nm) for the fixed rotamer 4. This spans a total variation of ~30 nm resulting from low energy conformational changes. Since conformational populations are very difficult to simulate reliably from energy calculations, we may conclude that predicting λ max to better than ±15 nm is computationally very difficult. It is worth noting a rather smaller uncertainty occurs in the band shape maxima λ max
; these are slightly blueshifted from the excitation energies to ~555.5, 561.5, 551.0 and 532 nm respectively due to contributions from higher energy but less intense excitations. The free base itself showed a small calculated blue shift compared to the protonated form (excitation energy 2.256 eV,
549.5 nm) The overall calculated band-shape of 1 matches that of the measured spectrum reasonably well (λ max
= 552 nm, Figure 5b), but this match is largely due to tuning the percentage of HF exchange in the PBE DFT method.
The spectrum of the methylated derivative 6 has a HOMO-LUMO excitation energy of 2.238 eV (554.1 nm), blue shifted by 3.5 nm compared to the excitation energy of pseudo-mauveine
1 for the analogous rotamer 1, with a calculated λ max
~552.5 nm (red line) blue shifted by ~2 nm compared to corresponding rotamer of pseudo-mauveine 1 (Figure 5a). This value corresponds to that measured for synthetic derivative 6 (λ max
= 554 nm).
12
60000
50000
40000
30000
20000
10000
0
250 350 450 550 650
Figure 5: Top (a) Calculated TD-DFT spectra using a modified PBE functional with 4% HFexchange calibrated to reproduce the absorption maximum at 552 nm and convoluted with a peak width at half height of 0.13eV, for pseudo-mauveine 1 (four rotamers) and the synthetic derivative 6 . The calculations are archived with DOIs: 6vv, 656 and 657 (for rotamers 1-3 of
1 ), 75x ( 1 , rotamer 1 with value fixed to crystal structure), 658 ( 1 , free base) and 6vt ( 6 ); resolved as e.g.
http://doi.org/6vv and from which full calculated properties including
13
geometries may be obtained. Bottom (b) Measured UV/VIS spectrum of pseudo-mauveine 1
(blue), the synthetic derivative 6 (red) and mauveine A 2 (green)
The origins of the shift observed between 1 , R=H and 6 , R=Me can be interpreted by showing the molecular orbitals involved in the excitations (Figure 6). The methyl derivative 6 has small HOMO and LUMO coefficients on the 8-methyl group that is sufficient to increase the excitation energy slightly.
Figure 6: Calculated HOMO and LUMO molecular orbitals for (a) 1 and (b) 6 . The calculations are archived in an open data repository, with DOI: 6vt and 6vv (resolved as eg http://doi.org/6vv).
Conclusion
Pseudo-mauveine sulphate 1 and a synthetic derivative of mauveine, 3-phenylamino-5-(2methylphenyl)-7-amino-8-methylphenazinium sulphate 6 , have been crystallised as picrate salts via their leuco-bases. Pseudo-mauveine 1 was synthesised by a number of different methods from aniline to emulate how it might have formed in small quantities in Perkin’s original mauveine made by the first historical method. Using a scaled PBE TD-DFT
14
procedure, one can use TD-DFT theory to calculate excitation energies and
λ max
to the lowest energy state responsible for the iconic mauve colour of these species. However, the precise value of
λ max is uncertain to about ±15 nm due to the conformational mobility of the 3substituent and any differences between the measured structure in the solid state and the solution populations, although substituent shifts induced for any specific rotamer may be computable more accurately, to perhaps ~±2 nm.
Experimental
IR spectra were recorded on a diamond-anvil FTIR spectrometer. UV spectra were recorded using a PerkinElmer Lambda 25 UV – Vis spectrometer with ethanol as the solvent.
1
H NMR spectra were recorded at 400 MHz using a Varian 400 spectrometer. Chemical shifts, δ are given in ppm measured by reference to the residual solvent and coupling constants, J are given in Hz. Low resolution and high resolution mass spectra were obtained at the University of Wales, Swansea using electron impact ionisation and chemical ionisation. Melting points were determined on a Kofler hot-stage microscope. The chemical shift for the picrate protons at 8.92 ppm were confirmed by comparison with the spectrum of picric acid in CD
3
OD. Flash silica was from Merck grade 40-63 μm code 9385 25 Kg drum.
32
Picrates were always handled with caution and were not left in direct sunlight. In all experiments here, and in this mauveine series of papers, cH
2
SO
4
is measured in drops from a 15 cm pasteur pipette, as specified previously.
25
There are about 65 drops of cH
2
SO
4 per ml with this particular pipette and not 20 as we previously assumed from an A-level physics experiment at school which determined the thickness of a molecule from a circular oil film on water.
The intensity data for the single crystal structure determinations were collected at the EPSRC
National Crystallography Centre, University of Southampton on a Rigaku CCD diffractometer (graphite monochromated Mo Kα radiation, λ = 0.71073 Å). The structures were solved without difficulty by direct methods with SHELXS-97 and the atomic models optimised by refinement against
F
2
with SHELXL-97.
33
The C13–C18 ring in 8 appeared to show disorder and was modelled as a rigid hexagon with C–C = 1.39 Å. The N-bound and
O-bound H atoms were located in difference maps: in 7 the hydrogen atom positions were freely refined, whereas in 8 the hydrogen atoms were refined as riding atoms in their as-found relative positions. The C-bound H atoms were placed geometrically and refined as riding
15
atoms. The constraint U iso
(H) = 1.2
U eq
(carrier) or 1.5
U eq
(methyl carrier) was applied in all cases.
7 : C
24
H
19
N
4
·C
6
H
2
N
3
O
7
(C
30
H
21
N
7
O
7
), M r
= 591.54, pale yellow plate, 0.06
0.05
0.01 mm, monoclinic, space group P 2
1
/ n (No. 14), Z = 4, a = 11.5580 (9) Å, b = 19.8491 (9) Å, c
= 11.9225 (8) Å,
= 107.902 (8)
, V = 2602.8 (3) Å
3
at 100 K. Number of measured and unique reflections = 29218 and 4833, respectively (–13
h
13, –23
k
24, –14
l
14;
2
max
= 51.0
; R int
= 0.110). Final R ( F ) = 0.064, wR ( F
2
) = 0.135 for 406 parameters and 2806 reflections with I > 2σ( I ) (corresponding R -values based on all 4833 reflections = 0.129 and
0.160, respectively), CCDC deposition number 1417926.
8 : C
26
H
22
N
4
·C
6
H
2
N
3
O
7
·C
2
H
6
O (C
34
H
30
N
7
O
8
), M r
= 664.65, red blade, 0.15
0.04
0.02 mm, monoclinic, space group P 2
1
/ n (No. 14), Z = 4, a = 15.6656 (14) Å, b = 7.3523 (7) Å, c
= 27.179 (2) Å,
= 97.093 (8)
, V = 3106.5 (5) Å
3
at 100 K. Number of measured and unique reflections = 16830 and 5474, respectively (–18
h
18, –8
k
7, –32
l
29;
2
max
= 50.0
; R int
= 0.067). Final R ( F ) = 0.121, wR ( F 2 ) = 0.275 for 433 parameters and 3091 reflections with I > 2σ( I ) (corresponding R -values based on all 5474 reflections = 0.190 and
0.308, respectively), CCDC deposition number 1417927.
Pseudo-mauveine picrate 7 : Method 1 Pseudo-mauveine 1 was prepared first.
25
N -Phenylp phenylenediamine 9 (400 mg, 2.17 mmol) and aniline (404 mg, 4.34 mmol) were added to distilled water (200 ml) mixed with cH
2
SO
4
(8 drops, 0.12 ml) then heated to 50–60
C to dissolve the N -phenylp -phenylenediamine 9 . The hot mixture was treated with K
2
Cr
2
O
7
(829 mg, 2.82 mmol) for 4–5 h then allowed to cool. The reaction mixture was filtered through a fine pore sinter (No 4), washed with water in portions (4
75 ml) then extracted in the sinter with MeOH (5
75 ml) using agitation each time prior to applying the water-pump vacuum. The combined extracts were evaporated to dryness in a beaker in a fume hood then purified by chromatography on silica gel (20% aqNH
3
/MeOH) in a fume hood. MeOH initially elutes by-products. The coloured product was evaporated to dryness then treated with hot water from a kettle (100 ml) followed by KOH pellets (1.5 g) with stirring. The material is scraped with a spatula to ensure all the dye has been deprotonated. After cooling
16
in an ice bath the leuco base of pseudo-mauveine was filtered off and washed with a small amount of water without agitation. The dye is then washed through the sinter with small portions of MeOH (25 ml
2) and the eluent poured in a small beaker. Commercial picric acid, stored under water, was then mixed in on the end of a spatula. The quantity was estimated and would have been a small excess. On slow partial evaporation of the solvent the title compound crystallises (10 mg, 3.1%) as golden plates, m.p. > 200
C. λ max
(EtOH)/nm
553 (log ε 4.7), 420sh (4.1), 356 (4.3) and 280 (4.7);
max
(diamond anvil)/cm
–1
3407w,
3319w, 3224w, 1628s, 1605s, 1589s, 1557s, 1526s, 1488vs, 1429s, 1387s, 1261s, 1158s,
1022s, 822vs, 743vs, 695s and 443s; δ
H
(400 MHz; CD
3
OD) 6.08 (1H, s), 6.38 (1H, s), 7.17
(2H, d, J = 8.0), 7.31 (3H, d, J = 8.0), 7.39 (1H, d, J = 6.0), 7.46 (1H, dd, J = 8.0 and 4.0),
7.53 (2H, d, J = 8.0), 7.83 (5H, m), 7.99 (1H, d, J = 12), 8.07 (1H, d, J = 8.0) and 8.92 (2H, s)
(picrate); m/z (orbitrap ASAP) 363.1602 (M
+
, 100%) C
24
H
19
N
4
requires 363.1604.
Pseudo-mauveine 1 Method 2 Aniline (1.0 g, 10.8 mmol) in distilled water (200 ml) containing cH
2
SO
4
(12 drops, 0.18 ml) was treated with K
2
Cr
2
O
7
(1.3 g, 4.42 mmol) and heated at 50–60
C for 5 h. After cooling, the mixture was filtered through a fine pore sinter and washed with water (4
75 ml). The product was extracted with MeOH (5
75 ml) with agitation each time in the sinter before applying the water-pump vacuum. The combined extracts were evaporated to dryness in a beaker in a fume hood then purified by chromatography on silica gel. MeOH initially elutes by-products then 20% aqNH
3
/MeOH elutes the title compound (9.0 mg, 0.9%) with identical spectroscopic properties to material reported previously.
Pseudo-mauveine 1 Method 3 The oxidation of aniline (500 mg, 5.38 mmol) with CuCl
2
has been reported previously to give the title compound (9 mg, 1.8%) with the same spectroscopic properties reported previously.
26
3-Phenylamino-5-(2-methylphenyl)-7-amino-8-methylphenazinium picrate 8 . A batch of starting material 6 was made as described previously.
25,22
The starting material 6 (30 mg) was prepared as a picrate and crystallised as before to give a poorly crystalline dark material. The single crystal structure was determined but owing to poor crystallinity of the sample only the
17
IR and UV spectra analysis was done; mp > 200
C. λ max
(EtOH)/nm 551 (log ε 4.6 ), 350 (
4.7) and 284 ( 4.7);
max
(diamond anvil)/cm
–1
3357w, 1609vs, 1495vs, 1311vs and 1186w.
Safranin picrate 11 Safranin 10 (200 mg, 0.62 mmol) in water (50 ml) was treated with KOH
(0.5 g) and filtered. The precipitate was dissolved with MeOH (30 ml) and treated with some picric acid stored under water, using a spatula. Crystallisation upon evaporation of the solvent gave the title compound (70 mg, 22 %) as red needles, mp > 200
C. λ max
(EtOH)/nm 400sh
(log ε 4.1) and 360 (log ε 4.3); max
(diamond anvil)/cm
–1
3077w, 1625s, 1599s, 1557vs,
1479s, 1436s, 1366s, 1322vs, 1156s, 1077s, 936s, 794vs, 744vs, 700vs, 545s and 520s;
δ
H
(400 MHz; CD
3
OD) 6.0 (2H, d, J = 2.0), 7.23 (2H, dd, J = 8.0 and 2.0), 7.55 (2H, d, J =
8.0), 7.79-7.87 (3H, m), 7.95 (2H, d, J = 8.0) and 8.92 (2H, s) (picrate); m/z (orbitrap ASAP)
287.1291 (M
+
, 100%) C
18
H
15
N
4
requires 287.1291.
N-tert-Butylmauveine A 13 and B 14 The method of synthesis of the mixture has been reported previously but not the separation or the spectroscopic data.
2,6-7
The crude mixture is obtained by chromatography of the reaction mixture with 20% aqNH
3
/MeOH. About 10–20 mg of the mixture is separated into fractions by chromatography on flash silica with secbutanol/EtOAc/H
2
O/HOAc (60:30:9.5:0.5) and the best fractions of the mauveine B isomer were combined and the best fractions of the mauveine A isomer were combined. Each combined fraction was evaporated then re-columned the same way, and then re-columned again. A total of 6 columns were run to produce 2 small fractions of firstly N-tertbutylmauveine B 14 as a purple solid, mp > 200
C. λ max
(EtOH)/nm 553 (log ε 4.74 ) and
282 (4.75);
max
(diamond anvil)/cm
–1
3333(br), 1557vs, 1404vs, 1343s, 1311s, 1017w, 923w and 647s; δ
H
(400 MHz; CD
3
OD) 1.31 (9H, s), 2.32 (3H, s), 2.40 (3H, s), 2.81 (3H, s), 6.11
(1H, s), 6.20 (1H, d, J = 4.0), 7.03 (2H, d, J = 8.0), 7.12 (2H, d, J = 8.0), 7.29 (1H, s), 7.50
(2H, d, J = 8.0), 7.76-7.83 (3H, m) and 7.94 (1H, s); m/z (orbitrap ASAP) 405.2070 (M
+
,
100%) C
27
H
25
N
4
requires 405.2074. Followed by N-tert-butylmauveine A 13 as a purple solid, mp > 200
C. λ max
(EtOH)/nm 552 (log ε 4.74) and 282 (4.75);
max
(diamond anvil)/cm
–1
1330(br), 1556vs, 1402vs, 1338s, 1304s, 1017w, 918w and 635s; δ
H
(400
MHz;CD
3
OD) 1.31 (9H, s), 2.32 (3H, s), 2.41 (3H, s), 6.14 (1H, s), 6.34 (1H, d, J = 4.0), 7.05
(2H, d, J = 8.0), 7.13 (2H, J = 8.0), 7.44 (1H, dd, J = 8.0 and 4.0), 7.52 (2H, d, J = 8.0), 7.77-
18
7.85 (3H, m), 7.90 (1H, s) and 8.04 (1H, d, J = 8.0); m/z (orbitrap ASAP) 391.1916 (M
+
,
100%) C
26
H
23
N
4
requires 391.1917.
Mauveine A 2 and B 4
8,21
The synthesis, via the mixture of N-tert-butylmauveine A 13 and B
14 , has already been reported, along with the spectroscopic data.
2,6-7 Here the original aromatic region of the
1
H NMR spectrum is published for the first time in the supplementary section. A total of 4 chromatography columns with flash silica were used to get pure fractions of mauveine A 2 and B 4 . The first column was with 20% aqNH
3
/MeOH, then fractions were collected with a second column using sec-butanol/EtOAc/H
2
O/HOAc (60:30:9.5:0.5) as eluent. The A and B fractions were combined separately, then re-columned the same way.
References
1.
M. M. Sousa, M. J. Melo, A. J. Parola, P. J. T. Morris, H. S. Rzepa and J. Sergio Seixas de
Melo, Chem. Eur. J ., 2008, 14 , 8507.
2. M. J. Plater, J. Chem. Res ., 2015, 39 , 251.
3. M. da Conceicao Oliveira, A. Dias, P. Douglas and J. Sergio Seixas de Melo, Chem. Eur.
J ., 2014, 20 , 1808.
4. J. Dale and H. Caro GB No 1307 1860 May 26 th
5. P. J. T. Morris, Hist. Tech ., 2006, 22 , 119.
6. M. J. Plater, J. Chem. Res ., 2014, 38 , 163.
7. M. J. Plater and W. T. A. Harrison, J. Chem. Res ., 2014, 38 , 651.
8. O. Meth-Cohn and M. Smith , J. Chem. Soc., Perkin Trans . I, 1994, 5.
9. O. Meth-Cohn and A. S. Travis, Chem. Brit ., 1995, 547.
10. T. M. Brown, C. J. Cooksey and A. T. Dronsfield, Ed. in Chem ., 2000, 75.
11. A. S. Travis, Bull.
Hist. Chem ., 2007, 32 , 35.
12. C. Heichert and H. Hartmann, Z. Nat ., 2009, 64b , 747.
13. S. Garfield, Mauve: How One Man Invented a Color That Changed the World , Faber &
Faber, 2001.
19
14. H. S. Rzepa, Molecules , 1998, 3 , 94.
15. G. Nagendrappa, Resonance , 2010, 15 , 779.
16. A. Filarowski, Resonance , 2011, 16 , 1140.
17. I. Holme, Color. Tech ., 2006, 122 , 235.
18. W. H. Cliffe, J. Soc. Dyers and Col ., 1956, 72 , 563.
19. C. J. Cooksey, R. Soc. Chem. Hist. Group Newslett.
, 2014, 66 , 22.
20. C. Cooksey and H. S. Rzepa, R. Soc. Chem. Hist. Group Newslett ., 2012, 61 , 11.
21. J. Sergio Seixas de Melo, S. Takato, M. Sousa, M. J. Melo and A.J. Parola, Chem.
Commun ., 2007, 2624.
22. M.J. Plater and W. T. A. Harrison, J. Chem. Res ., 2013, 37 , 427.
23. A. S. Gaballa and A. S. Amin, Spectrochim. Acta A. Mol. Biomol. Spec . 2015, 145 , 302.
24. J. Bernstein, R. E. Davis, L. Shimoni and N.-L. Chang, (1995). Angew. Chem. Int. Ed.
Eng . 1995, 34 , 1555.
25. M. J. Plater, J. Chem. Res ., 2011, 35 , 304.
26. M. J. Plater, J. Chem. Res ., 2015, 39 , 180.
27. L. Goerigk and S. Grimme, J. Chem. Phys ., 2010, 132 , 184103.
28. L. Goerigk, J. Moellmann and S. Grimme, Phys. Chem. Chem. Phys , 2009, 11 , 4611.
29. T. Risthaus, A. Hansen and S. Grimme, Phys. Chem. Chem. Phys , 2014, 16 , 14408.
30. J. P. Perdew, K. Burke, and Y. Wang, Phys. Rev. B , 1996, 54 , 16533.
31. C. A. Guido, E. Brémond, C. Adamo, and P. Cortona, J. Chem. Phys . 2013, 138 , 021104.
32. W. C. Still, M. Kahn and A. Mitra, J. Org. Chem ., 1978, 43 , 2923.
33. G.M. Sheldrick, Acta Cryst ., Sect. A: Fund. Cryst . 2008, A64 , 112.
Supplementary
1 H NMR spectra of the expanded aromatic region of mauveine A and mauveine B
Acknowledgements
20
We thank the EPSRC National Mass Spectrometry Service Centre (University of Swansea) for measuring mass spectra and the EPSRC National Crystallography Service Centre
(University of Southampton) for collecting the diffraction data.
21
