pachut 10048 suppl. appendices.
advertisement
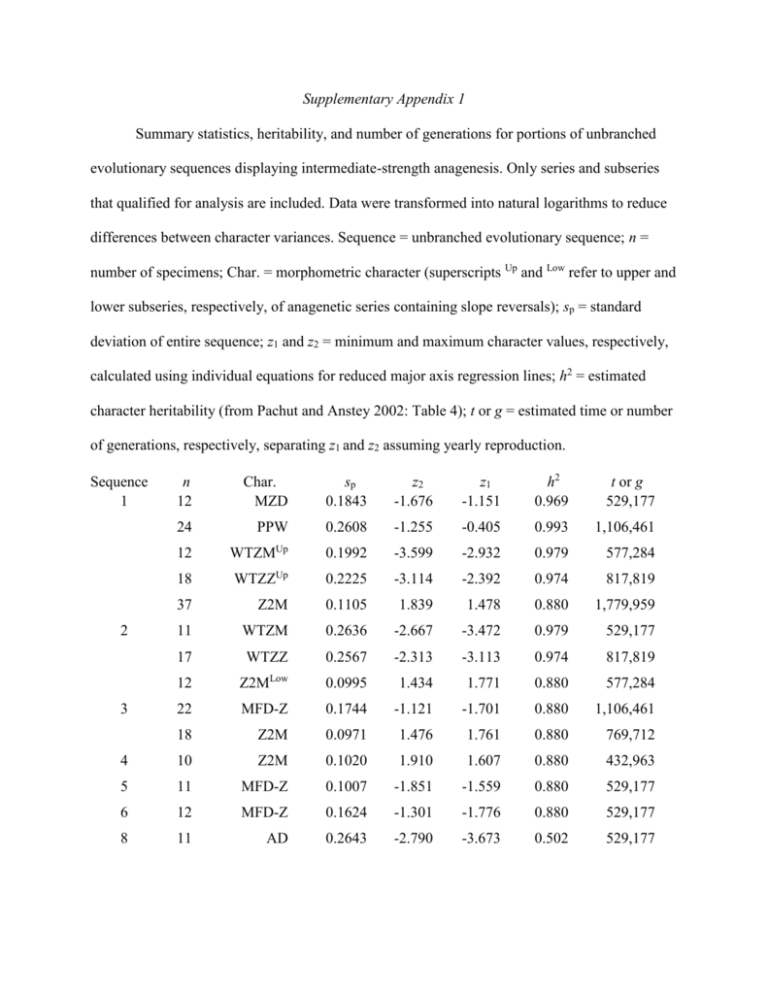
Supplementary Appendix 1 Summary statistics, heritability, and number of generations for portions of unbranched evolutionary sequences displaying intermediate-strength anagenesis. Only series and subseries that qualified for analysis are included. Data were transformed into natural logarithms to reduce differences between character variances. Sequence = unbranched evolutionary sequence; n = number of specimens; Char. = morphometric character (superscripts Up and Low refer to upper and lower subseries, respectively, of anagenetic series containing slope reversals); sp = standard deviation of entire sequence; z1 and z2 = minimum and maximum character values, respectively, calculated using individual equations for reduced major axis regression lines; h2 = estimated character heritability (from Pachut and Anstey 2002: Table 4); t or g = estimated time or number of generations, respectively, separating z1 and z2 assuming yearly reproduction. n 12 Char. MZD sp 0.1843 z2 -1.676 z1 -1.151 h2 0.969 t or g 529,177 24 PPW 0.2608 -1.255 -0.405 0.993 1,106,461 12 WTZMUp 0.1992 -3.599 -2.932 0.979 577,284 18 WTZZUp 0.2225 -3.114 -2.392 0.974 817,819 37 Z2M 0.1105 1.839 1.478 0.880 1,779,959 11 WTZM 0.2636 -2.667 -3.472 0.979 529,177 17 WTZZ 0.2567 -2.313 -3.113 0.974 817,819 12 Z2MLow 0.0995 1.434 1.771 0.880 577,284 22 MFD-Z 0.1744 -1.121 -1.701 0.880 1,106,461 18 Z2M 0.0971 1.476 1.761 0.880 769,712 4 10 Z2M 0.1020 1.910 1.607 0.880 432,963 5 11 MFD-Z 0.1007 -1.851 -1.559 0.880 529,177 6 12 MFD-Z 0.1624 -1.301 -1.776 0.880 529,177 8 11 AD 0.2643 -2.790 -3.673 0.502 529,177 Sequence 1 2 3 Supplementary Appendix 2 Summary statistics, heritability, and number of generations for portions of unbranched evolutionary sequences displaying weak anagenesis. Only series or subseries that qualified for analysis are included. Data were transformed into natural logarithms to reduce differences between character variances. Column headings are described in Supplementary Appendix 1. Superscripts Up and Low refer to upper and lower portions, respectively, of anagenetic series containing slope reversals. n 10 Char. M2M sp 1.294 z2 2.595 z1 -1.198 h2 0.965 t or g 432,963 13 MC-Z 0.107 1.809 2.028 0.863 577,284 11 MWT 0.157 -2.579 -3.066 0.976 481,070 10 MZD 0.097 -1.383 -1.681 0.969 529,177 27 PPZUp 0.122 -1.155 -0.744 1.000 1,298,889 11 PPZLow 0.073 -0.917 -0.700 1.000 577,284 18 SI-M 1.671 1.712 -3.352 0.953 769,712 10 WTZZ 0.356 -2.789 -3.870 0.974 673,498 11 ZSMLow 0.080 3.126 2.904 0.981 481,070 19 W2M 0.199 2.426 1.790 0.849 865,926 3 18 MD-ZED 0.260 -1.553 -0.791 0.757 769,712 4 12 WTZZ 0.296 -2.887 -3.805 0.974 721,605 5 12 MD-ZED 0.310 -0.443 -1.286 0.757 529,177 14 MZD 0.114 -1.327 -1.672 0.969 721,605 18 PPW 0.209 -0.939 -1.621 0.993 962,140 19 PPZ 0.189 -1.201 -0.614 1.000 914,033 12 Z2M 0.112 1.597 1.926 0.880 529,177 10 PPW 0.185 -1.103 -1.693 0.993 529,177 11 ZV-MAX 0.171 -2.179 -2.653 0.962 481,070 10 M2M 0.625 -0.648 1.314 0.965 914,033 12 ZWT-ZED 0.385 -1.053 -2.151 0.857 529,177 Sequence 1 6 7 8 Supplementary Appendix 3 Rates of evolution, in darwins, calculated for 93 taxa of fossil protists and invertebrates. Source indicated by superscripts: 1 = Van Valen (1974: Table 2, p. 299), 2 = Hallam (1975: Tables 1 and 2, p. 494). Van Valen’s data included both continuous measurements and counts with durations estimated in millions of years. Hallam measured the maximum dimension attained by each taxon and equated time with the number of zones between first and last occurrences; the estimated average zonal duration was 106 years. Some taxa have values calculated for multiple time intervals and/or multiple characters. Mean = average across all data; Mean minus stelleroids = stelleroids removed; Mean minus stelleroids and high rates = stelleroids and high rates (>1.0 darwin) removed from calculations. Consult appropriate tables in the original publications for more details. Taxon Ammonoidea Arnioceras semicostatum2 Aulacostephanus2 Caenisites-Asteroceras2 Cardioceras2 Coroniceras-Primarietites2 Creniceras dentatum2 Garantiana-Parkinsonia2 Glochiceras2 Grammoceras-Phylseogrammoceras2 Idoceras2 Kosmoceras (Gulielmites)2 Leioceras2 Liparoceras2 Metophioceras conybeari2 Ochetoceras2 Pectinatites2 Pinacoceratidae1 Pleuroceras2 Psiloceras2 Taramelliceras2 Brachiopoda Eocoelia1 Time interval (millions of years) Rate (darwins) 4 3 2 2 1 3 2 10 2 5 1 1 3 0.33 15 3 35 1 1 12 2.07 10-1 3.28 10-1 4.59 10-1 3.8310-1 9.28 10-1 3.110-1 7.810-1 6.410-2 4.210-1 1.410-1 1.1 8.310-1 5.410-1 3.7 5.710-2 2.110-1 4.010-2 2.6 9.710-1 1.710-1 5, 5 9.010-2, 9.010-2 Dictyorthyris1 Cyrtospirifer1 Gypidula1 Terebratuloidea1 Pentameroidea1 Punctospirifer1 Productacea1 Rafinesquina1 Richthofeniidae1 Bryozoa Fenestrellinidae1 Echinoidea Micraster1 Holasteridae1 Melechinoidea1 Foraminifera Bollylnoides1 Ataxophragmiidae1 Frondicularia1 Gavelinellidae1 Lagena1 Orbitoides1 Globoconusa1 Fusilinidae1 Nummulitidae1 Graptoloidea Neocucullograptinae1 Ostracoda Cytherella1 Ovocytheridea1 Mehesella1 Leguminocythereis1 Cythereis1 5 8, 15 2 40 20 30 20 20 40 9.010-2 1.010-2, 0 1.4010-1 4.010-2 5.010-2 5.010-2 1.410-1 5.010-1 4.010-2 25 2.010-2 18, 18 5, 5 20 8.010-2, 2.010-2 2.610-1, 5.010-2 6.010-2 18 10 2 20 6 6, 7 6, 7 4, 4 4 45 25 2.010-2, 3.010-2 8.010-2 3.010-1 2.010-2 1.410-1 6.010-2, 1.010-1 9.010-2, 1.210-1 4.010-2, 1.310-1 7.010-2 8.010-2 2.010-1 5, 5 1 2, 1 3 2.010-2, 3.0101.910-1 4.010-2, 5.010-2 8.010-2 7 3 15 3 8 3.010-3 4.010-3 3.010-2 7.010-2 9.010-3 Trachyleberis1 Buntonia1 Pelecypoda Argopecten1 Astarte elegans2 Astarte geuxi2 Barbatia pectinata2 Camptonectes Iohbergensis-lamellosa2 Cardinia concinna2 Ceratomyopsis striata2 Chlamys textoria2 C. (Radulopecten) fibrosa-inaequicostata2 Coelopis lunulatus2 Ctenostreon tuberculatum-pectiniforme2 Entolium lunare2 Eocallista antiopa-brongniarti2 Eonavicula minuta-quadrisulcata2 Eopecten velata2 Eopecten abjecta2 Gervillella lanceolata-aviculoides2 Goniomya hybrida-literata2 Grammatodon insons2 Grammatodon insons-oblonga2 Gryphaea1 Gryphaea arcuata-gigantea2 Gryphaea bilobata-dilatata2 Isocyprina menkei-dolabra2 Liostrea irregularis2 Modiolus hillanus-imbricatus2 Myalina1 Myophorella signata-clavellata2 3 3, 3 2, 25 9.010-3 4.0 10-2, 4.0 10-2 8.0 10-3, 2.0 10-2 10, 8 8, 7 2, 8 8, 10 8, 8 7, 2 8, 8 13 8 21 55 11 18 10 14 6 60 8 18 23 11 24 40 33 8 20 8, 8 11 26 19 13 25 50 28 1.410-1, 1.610-1 3.0 10-2, 1.0 10-2 9.010-2, 1.210-1 5.010-3, 2.010-2 6.010-3, 8.0103 3.010-3, 1.910-2 1.010-2, 2.010-2 9.210-2 1.210-1 3.410-2 4.310-2 1.610-1 4.310-2 1.610-1 5.810-2 2.110-1 3.010-2 2.010-1 8.910-2 7.110-2 6.810-2 3.110-2 5.510-2 2.810-2 1.910-1 8.310-2 1.310-1, 1.610-1 9.0 10-2 4.010-2 7.010-2 1.210-1 6.710-2 4.010-2 2.810-2 Palaeonucula navis-hammeri2 Parallelodon buckmani2 Parallelodon hirsonensis2 Pholadomya ambigua2 Pholadomya lirata-protei2 Plagiostoma gigantea-hersilia2 Plicatula laevigata2 Propeamussium pumilum-laeviradiatum2 Protocardia phillipiana-dissimilis2 Pseudomytiloides dubius2 Pseudopecten aequivalvis2 Ryderia graphica2 Thracia depressa2 Stelleroidea1 11 10 6 10 22 21 3 6 56 5 3 8 40 100, 350 1.610-1 8.510-2 1.810-1 1.110-1 3.110-2 3.9 10-2 2.210-1 3.110-1 1.610-2 1.510-1 5.510-1 1.710-1 2.910-2 1.510-2, 5.010-3 Range 0.33 - 350 510-3 – 3.7 Mean 16.5 (33.9) 1.810-1 Mean minus stelleroids 13.2 (13.9) 1.910-1 Mean minus stelleroids and high rates 13.5 (13.9) 1.310-1
