FOR ONLINE PUBLICATION ONLY Appendix A. Temporal
advertisement
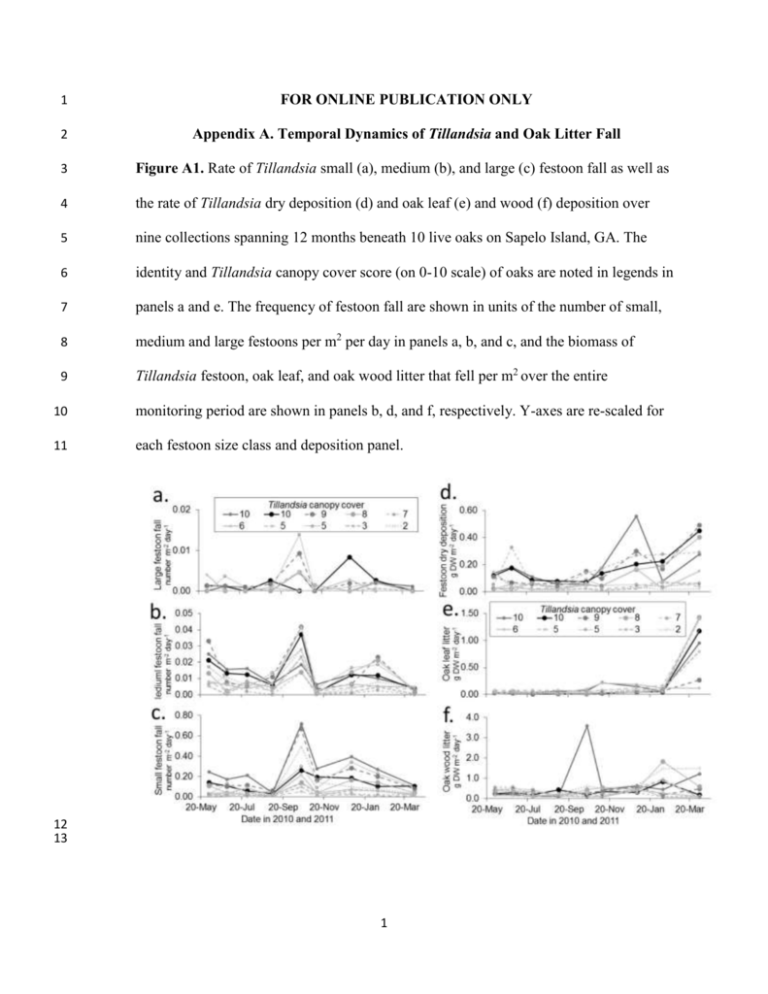
1 FOR ONLINE PUBLICATION ONLY 2 Appendix A. Temporal Dynamics of Tillandsia and Oak Litter Fall 3 Figure A1. Rate of Tillandsia small (a), medium (b), and large (c) festoon fall as well as 4 the rate of Tillandsia dry deposition (d) and oak leaf (e) and wood (f) deposition over 5 nine collections spanning 12 months beneath 10 live oaks on Sapelo Island, GA. The 6 identity and Tillandsia canopy cover score (on 0-10 scale) of oaks are noted in legends in 7 panels a and e. The frequency of festoon fall are shown in units of the number of small, 8 medium and large festoons per m2 per day in panels a, b, and c, and the biomass of 9 Tillandsia festoon, oak leaf, and oak wood litter that fell per m2 over the entire 10 monitoring period are shown in panels b, d, and f, respectively. Y-axes are re-scaled for 11 each festoon size class and deposition panel. 12 13 1 14 Figure A2. Wood and acorn deposition beneath each of our 10 monitored oaks per collection 15 period (a,c) and the total wood and acorn deposition per year over the entire year-long 16 monitoring period (b,d). Tillandsia canopy cover for each oak is denoted by the number listed in 17 the legend (score of 0-10 based on Callaway and others 2002), and individual oak trees are 18 distinguished by different colors and symbols. 19 2 Appendix B. Summary of Litter Deposition Analyses 20 21 Table B1. Summary of Best-fit Models Describing the Relationship Between Source 22 Population Size, that is, Tillandsia Canopy Cover, T, and Several Metrics of Festoon 23 Deposition and Oak Leaf, Wood, and Acorn Deposition Tillandsia canopy cover significance Best-fit model T slope Texponent Pslope P exponent Tillandsia canopy cover = T Festoon deposition response 24 Small festoons m-2 y-1 Y = 6.54* T 8.09 NA <0.0001 NA Medium festoons m-2 y-1 Y = 4.86 NA NA NA NA Large festoons m-2 y-1 Y = 0.062*T 7.27 NA <0.0001 NA g DW festoons m-2 y-1 Y = 6.40*T 11.67 NA <0.0001 NA g DW oak leaves m-2 y-1 Y = 72.84 NA NA NA NA g FW wood m-2 y-1 Y = 143.01 NA NA NA NA g FW acorn m-2 y-1 Y= 17.05 NA NA NA NA Best-fit models were selected using AICc (Burnham and Anderson 2002). 25 3 26 Appendix C. Summary of Understory Invertebrate Community Composition 27 Table C1. List of Invertebrate Orders Observed and Surveyed in the Festoon Removal 28 and Festoon Size Experiments and the Number of Plots of Each Treatment (Out of 8 29 Replicate Plots per Treatment and Site) in Which Each Invertebrate Order was Observed Experiment Phylum, Class, Order Festoon removal: Festoon removal: Long Tabby King’s Field Festoon size experiment Control Removal Control Removal Control Small Medium Large 3 0 6 0 0 0 0 5 1 0 1 0 0 0 0 0 4 6 6 3 0 0 2 1 1 1 2 0 0 0 0 0 4 1 1 0 0 0 0 0 0 0 1 0 0 0 0 0 8 1 6 0 0 0 0 3 0 0 1 0 0 0 0 0 (common name) Mollusca, Gastropoda, Pulmonota (land snails) Annelida, Oligochaeta, Megadrilacea (earth worms) Arthropoda, Insecta, Blattodea (roaches) Arthropoda, Insecta, Lepidoptera (moths, butterflies) Arthropoda, Insecta, Diptera (true flies) Arthropoda Insecta, Coleoptera (darkling beetle) Crustacea, Malacostrea, Isopoda (pill or sow bugs) Arthropoda, Insecta, Phasmatodea (stick bugs) 4 Arthropoda, Insecta, 1 0 1 0 0 0 0 0 Orthoptera (grasshoppers) Arthropoda, Arachnida, 5 5 4 3 2 0 0 0 7 5 8 5 0 1 3 4 1 0 3 0 0 0 0 1 0 1 3 1 0 0 0 0 0 0 0 0 0 0 0 1 Araneae (spiders) Arthropoda, Insecta, Hymenoptera (ants) Arthropoda, Insecta, Embioptera (webspinners) Arthropoda, Insecta, Blattodea (termites) Arthropoda, Myriapoda, Diplopoda (millipede) 30 31 32 33 5 34 Appendix D. Effects of Festoon Size on Understory Community Structure and 35 Decomposition 36 Table D1. The Effect of Festoon Size on Understory Community Structure and Decomposition Experimental Treatment Control Response Metric Mycelia Invertebrates per m2 Small Festoon Mean Mean ± ±SE SE 0.06 ± 0.13 ± 0.06 0.13 0.13 ± 0±0 t or z 0.26 Medium Festoon P- Mean ± value SE 0.8012 1.0 ± Mean ± t or z|) SE z 0.0502 4.5 ± 9.46 <0.0001 -0.01 0.9923 3.6 ± 4.39 <0.0001 0.5 ± 0.20 0.2 3.01 ± 2.56 ± 0.16 0.13 3.09 ± 2.97 ± 0.13 0.15 Prop. Tethered 0.27 0.29 ± leaves lost ±0.13 0.15 0.00 1.0000 1.8 ± 2.60 0.0092 3.32 4.53 0.0001 2.76 0.0104 3.95 0.0005 0.0009 0.5314 3.19 ± 17.6 ± 6.4 2.21 0.0271 0.3 0.63 P-value 0.54 1.2 0.50 ± Decomposition, 2.05 Pr(>|t or 0.52 0.13 Invertebrate richness t or z Large Festoon 2.0 ± 0.5 -1.56 0.1317 0.15 4.29 ± 0.28 K, after 58 days Decomposition, 1.16 0.2574 3.54 ± -0.29 0.7754 0.25 4.17 ± 0.45 K after 112 days 37 38 39 40 41 0.22 0.8291 0.55 ± 0.25 3.09 0.0045 0.63 ± 0.45 The significance of festoon size treatments relative to no festoon, controls on mycelia score, K at 58 and 112 days, proportion of tethered leaves lost was assessed using ANOVA (z and P(>|z|) shown) and on isopod density and invertebrate richness was assessed using generalized linear models (t and P (>|t|) shown). For each response, the mean and standard error for eight replicate plots per treatment are also shown. 42 6 43 44 Appendix E. Festoon Removal Effects on Understory Community Structure and Decomposition 45 Table E1.Summary of the Effect of Removing Fallen Tillandsia Festoons from the Understory 46 on Community Structure and Litter Decomposition Beneath Oaks at King’s Field and Long 47 Tabby Sites King’s Field 48 49 50 51 52 Long Tabby Festoon Treatment Response Tillandsia Tillandsia Tillandsia Tillandsia variable control removal control removal Est. St. Err z or t P-value % plant cover 27.4 ± 11.4 73.4 ± 21.9 26.1 ± 7.9 44.2 ± 4.8 -1.37 0.08 -18 <0.0001 Mycelia score 5.8 1.1 0.5 0.2 7.1 0.3 2.5 0.4 14.5 0.93 15.6 <0.0001 Mush. density 5.1 1.3 2.7 0.9 12 ± 2.4 4.6 ± 1.6 0.86 0.09 9.7 <0.0001 Mush. richness 1.3 ± 0.2 0.6 ± 0.1 1.7 ± 0.2 0.8 ± 0.1 0.72 0.21 3.5 0.0006 Isopod density 3.0 0.5 0.05 0.05 3.5 ± 1.2 0 0.0 5.0 1.0 5.0 <0.0001 Invert. richness 2.8 0.3 1.3 0.2 2.6 0.3 1.1 0.3 0.82 0.16 5.2 <0.0001 Litter depth (cm) 6.2 0.5 2.7 0.3 6.4 0.4 2.7 0.2 3.62 0.36 10.1 <0.0001 K after 65 days 1.6 0.1 1.3 0.09 1.7 0.1 1.4 0.1 0.26 0.10 2.7 0.012 The mean ± standard error of eight replicate plots per Tillandsia treatment are shown for each response metric at each site. The significance of festoon treatment on percent plant cover, mycelia score, litter depth K at 65 days, was assessed using ANOVA (z and P(>|z|) values shown) and on mushroom density, mushroom richness, isopod density, and invertebrate richness were assessed using generalized linear models (t and P (>|t|) shown). 7
