Using PSPP, the open-source version of SPSS
advertisement
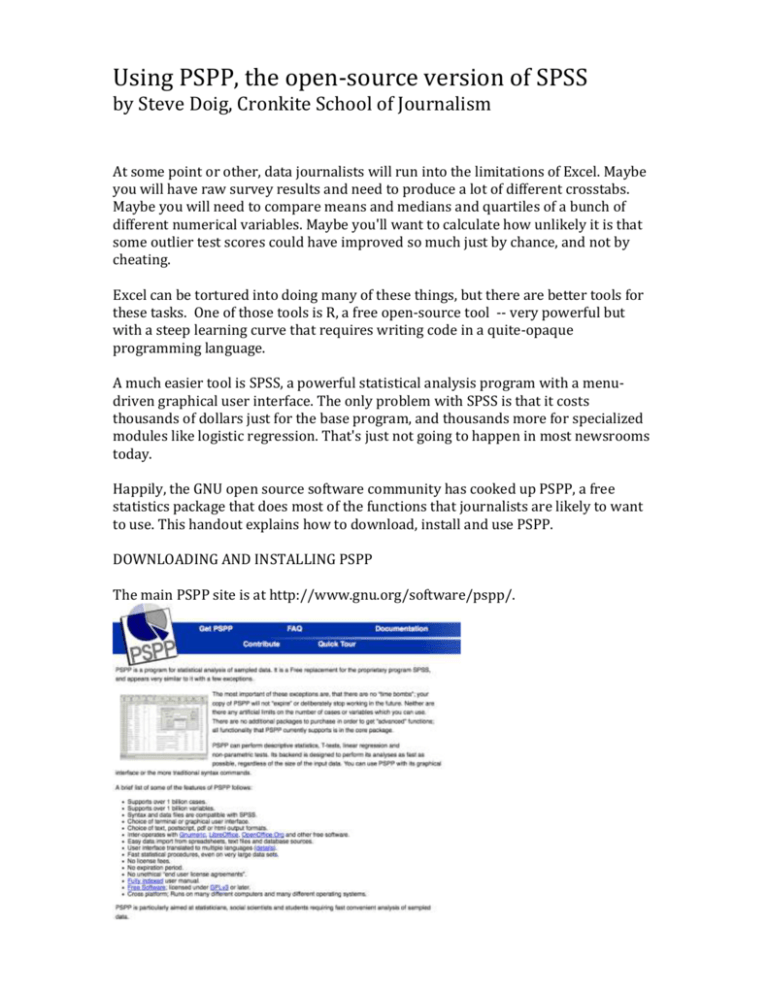
Using PSPP, the open-source version of SPSS by Steve Doig, Cronkite School of Journalism At some point or other, data journalists will run into the limitations of Excel. Maybe you will have raw survey results and need to produce a lot of different crosstabs. Maybe you will need to compare means and medians and quartiles of a bunch of different numerical variables. Maybe you'll want to calculate how unlikely it is that some outlier test scores could have improved so much just by chance, and not by cheating. Excel can be tortured into doing many of these things, but there are better tools for these tasks. One of those tools is R, a free open-source tool -- very powerful but with a steep learning curve that requires writing code in a quite-opaque programming language. A much easier tool is SPSS, a powerful statistical analysis program with a menudriven graphical user interface. The only problem with SPSS is that it costs thousands of dollars just for the base program, and thousands more for specialized modules like logistic regression. That's just not going to happen in most newsrooms today. Happily, the GNU open source software community has cooked up PSPP, a free statistics package that does most of the functions that journalists are likely to want to use. This handout explains how to download, install and use PSPP. DOWNLOADING AND INSTALLING PSPP The main PSPP site is at http://www.gnu.org/software/pspp/. PSPP is available for most computer operating systems. We'll focus here just on MS Windows and Mac OSX: Windows: Go to http://pspp.awardspace.com/ and click on the 32-bit or 64-bit version, depending on what your operating system is. If you're not sure, use the 32bit version. (IMPORTANT NOTE: I couldn't get the version dated 2013-02-08 to work; it kept crashing. Try the 2013-01-04 version instead!) Make sure your virus checker is off, and tell it to Run. It should only take a couple of minutes to download and install. Mac OSX: Go to http://lavergne.gotdns.org/projects/pspp/ and download to your desktop the version that matches your flavor of OSX (10.8, 10.7, etc.) You'll get the "open box" icon on your desktop. Double-click and the installer will start. Follow the stops and you're done. THE PSPP WORKSPACE Like SPSS, PSPP has a Data Editor window that looks like a spreadsheet -- rows and columns. The Rows are numbered, but the columns are named for the variables in the dataset. Notice at the bottom left: There are two tabs -- Data View (the one that looks like a spreadsheet) and Variable View. The Variable View window will show you important details about the variables in your dataset. You can use the Variable View window to set the formats of your data, and also to add text labels for coded variables (such as 1=Male, 2=Female). There also is a separate second window called the Output Viewer. That's where the results of your analyses will appear. LOADING DATA PSPP can open SPSS datasets that are in the *sav format. PSPP also can import delimited text files, such as comma-separated or tab-separated files. However, PSPP cannot import other file types that SPSS can handle, most notably Excel files. If you have Excel data that you want to bring into PSPP, you should save the Excel file as one of the text formats, like *.csv., and then open that with PSPP. ANALYZING DATA WITH PSPP Much of your work with PSPP will be done using the Analyze choice on the toolbar. Here are the choices you will get under Analyze: We'll look at the choices most likely to be used by reporters: Descriptive Statistics Compare Means Bivariate Correlation Regression. DESCRIPTIVE STATISTICS Click on Descriptive Statistics, and these choices appear: "Frequencies" is used to produce frequency tables that count how many you have of categorical variables (things like sex, nationality, type of crime, etc.) You'll get a window like this: To use it, select the variables you want and move them into the Variable(s) box: When you hit OK, you'll get output like this: With numerical variables, you'll get output like this (only the bottom of the long frequency table of birth years is shown): "Descriptives", also on the Descriptive Statistics menu, is used to give you useful statistics about numerical variables, including any or all of these measures: With Excel, you would have to write separate functions for each of these measures and for each of the variables you want. With PSPP, you simply check the measures you want, then select the variables you want and move them into the Variables box: Select... Click the arrow... and then hit OK. You will get this result in your Output Viewer: "Explore" will let you get descriptive statistics for numerical variables broken out by one or more categorical variables (called factors). For instance in the example dataset, for each constituency and for each party PSPP will generate for the birth year variable the average, median, maximum, minimum, range and other useful descriptives. Here's a small part of that output: "Crosstab", the last choice on the Descriptive Statistics menu, will give you a frequency table in rows and columns: When you hit OK, you will get this (here it's a partial view of a larger table): To read it, for example, the Centre Party has a total of 73 electors. They are 11.51% of all 634 electors. Eighteen of the Centre Party electors are in the Ávjovári constituency. Ávjovári has 24.66% of all Centre Party electors, and the 18 Centre Party electors make up 9.63% of all Ávjovári electors. (TIP: You can choose under Cells... to see only the count, or just the row or column percentages to get a less-busy display.) Crosstab also will calculate a chi-squared value that will tell you the probability that the pattern you see in the table might just have happened by chance -- what is known as statistical significance. However, the chi-squared test usually is useful only when you are working with sample data and relatively small sample sizes; an example might be if you are analyzing responses in a public opinion survey. But in most cases, journalists are working with large, complete datasets instead of samples. When the number of cases is large, the chi-squared test always returns a value that says it is statistically significant. COMPARE MEANS...MEANS... The Compare Means menu primarily is for when you have sample data and you need to know if there is a statistically significant difference in the means (averages) of a variable by different categories. For example, say you have a dataset that is the records of the amounts of meth confiscated in arrests by police over several years. You want to know if the average size of these busts is getting larger or smaller over time. Compare Means...Means... will tell you the answer. PSPP also will do so-called t-tests that will tell you if the difference in means is statistically significant. Again, with large datasets the results always will be statistically significant -- though not necessarily of practical significance. BIVARIATE CORRELATION Bivariate correlation will measure how strongly two or more numerical variables are related to each other. For each set of two variables, it produces a number (called Pearson's r) that measures the strength of the relationship. Pearson's r ranges from 1 (perfect positive correlation, meaning that as one variable goes up the other also goes up) to -1 (perfect negative correlation, meaning that as one variable goes up the other goes down). If r is close to zero, it means there is little or no relationship between the two. A positive r would be found in something like height and weight; in general, the taller people are the more they weigh. An example of a negative r would be gas mileage (or liters per kilometer in most of the world) and car weight; as weight goes up, gas mileage goes down. Note well that correlation doesn't necessarily mean that one variable is causing the change in the other variable. For instance, there is a strong positive correlation between the number of churches and the amount of alcohol consumed. (The hidden variable causing change in both is the size of the population.) The Bivariate Correlation menu can produce a so-called correlation matrix that calculates Pearson's r for all the numerical variables that interest you, each against the other. First, pick your variables of interest: Hit OK, and you get this kind of table. This example shows a strong .79 correlation between the number of violent crimes and traffic offences, but negative correlations for both of them with environment offences: REGRESSION The Regression...Linear menu is where you measure how well one or more independent variables do at predicting the value of a dependent variable. Our example here will be to measure how well poverty rates predict the reading test scores at a group of elementary schools. The data for the 1,642 schools looks like this, with LOWINCPC showing the percentage of children in poverty and READMED the median standardized reading score of the children. An x-y scatterplot of the data looks like this: You can see that as poverty increases, reading scores generally decrease -- but with plenty of outliers. To do the regression analysis, assign your variables. One way is to think of the independent variable as the one that happens before the dependent variable. In this case, you can imagine how poverty might influence test scores, but it's hard to see how a child's bad test score can cause a family to plunge into poverty. Hit OK, and you get this: The most useful parts are the R-Square value (.39 here), the coefficient Constant (33.35 here) and the coefficient for your independent variable (here, LOWINCPCT at -.23. You use the coefficients to build the regression model that will predict the dependent value given a particular independent value. The model is the formula for graphing a straight line: y=m*x+b (where y is the dependent value, m is the slope of the line, x is the independent value, and b is the place on the y-axis where the line crosses. Here, that would be this formula: READMED = -.23 * LOWINCPCT + 33.35 Thus, a school with a poverty rate of 40% would be predicted by this formula to have a reading score of about 24. Here's the math: -.23 * 40 + 33.35 = 24.15. Now, for the R-Squared. It tells you how good your regression formula is at predicting the dependent values. If you didn't have the independent variable, your best guess of the value of the dependent variable for any record would be the mean of all the dependent values. But if you guessed the mean over and over for all the data, the total error (called the variance) would be high because most values are well above or below the mean. However, the R-Squared value is interpreted as the percentage of that variance that can be explained by the independent value; consider it as how much the error caused by just guessing the mean can be reduced. In this example, 39% of the variance in reading scores is explained by the varying poverty levels. (Of course, this also means that 61% of the variance is caused by other factors which aren't addressed in this data.) The regression function in PSPP gets particularly useful when you save the socalled "residuals", which are the amount that each school's actual score differs from it's predicted score. A school with 40% poverty is predicted to have a reading score of 24. If that school's actual score is 34, the residual will be 10; if the actual score is 19, the residual will be -5, and so on. To save residuals in PSPP, hit the "Save..." button on the regression window: to get this window: Check both Predicted Values and Residuals., then Continue. When you run the regression, PSPP will create two new variables RES1 and PRED1, like this: Now you can see that the formula predicted, for instance, that Clayton Elementary, with 79% poverty, would have a reading score of about 15. But the actual score there was 35, so the residual is +20 points. On the other hand, Highland Park Elementary with just 10% poverty was predicted to have a reading score of nearly 31, but the actual score there was 20 so the residual is nearly -11. Using PSPP to do a regression and calculate predicted and residual values can help you quickly find outliers -- cases where someone is doing much better or much worse than would be expected based on the value of the independent variable. The higher your R-Squared value, the better your model. (Perfect would be 100%, but values near that high are never seen in social science data.) OTHER FEATURES OF PSPP PSPP can do a variety of other things that are useful in data analysis: DATA...SPLIT FILE...COMPARE GROUPS can be used to calculate means and other statistics within categorical groups, like comparing men and women. DATA...SELECT CASES will let you do analyses just on the cases that meet some criteria. For instance, imagine you wanted to do a regression analysis just on the values for men. You use this function to filter out the women in the data. DATA...WEIGHT CASES allows you to used so-called weighted data. For instance, survey data often includes a "Person Weight" variable that tells you how many people in the larger population a particular respondent represents. When you turn on the weighted data option, your results will look as though everyone in the population had responded. TRANSFORM...COMPUTE lets you create new variables, much like using formulas and functions in Excel. For instance, if you have a dataset giving the population and number of violent crimes in each city, you can compute a new variable called "crime rate" for each city using the two variables. TRANSFORM...AUTOMATIC RECODE lets you create a new variable that, for instance, will collapse down another variable with many values into a smaller number of groups. For instance, imagine a dataset of individuals with their ages. You could use Recode to create a new variable Age Group with groups "24 or younger", "Age 25-64" and "Age 65 or higher". CONCLUSION PSPP is not a perfect substitute for SPSS; for one thing, SPSS will easily make all sorts of data graphics that PSPP can't readily do. SPSS also will do a much larger variety of arcane statistical procedures and tests. However, most of those additional features are unlikely to be used by journalists for stories. What PSPP can do for you is do some basic analyses and procedures that would be very clunky to try to do using Excel. And with the price being free, that can make PSPP a useful tool for data journalists on a tight budget.

