Chapter 21 excercise answers
advertisement
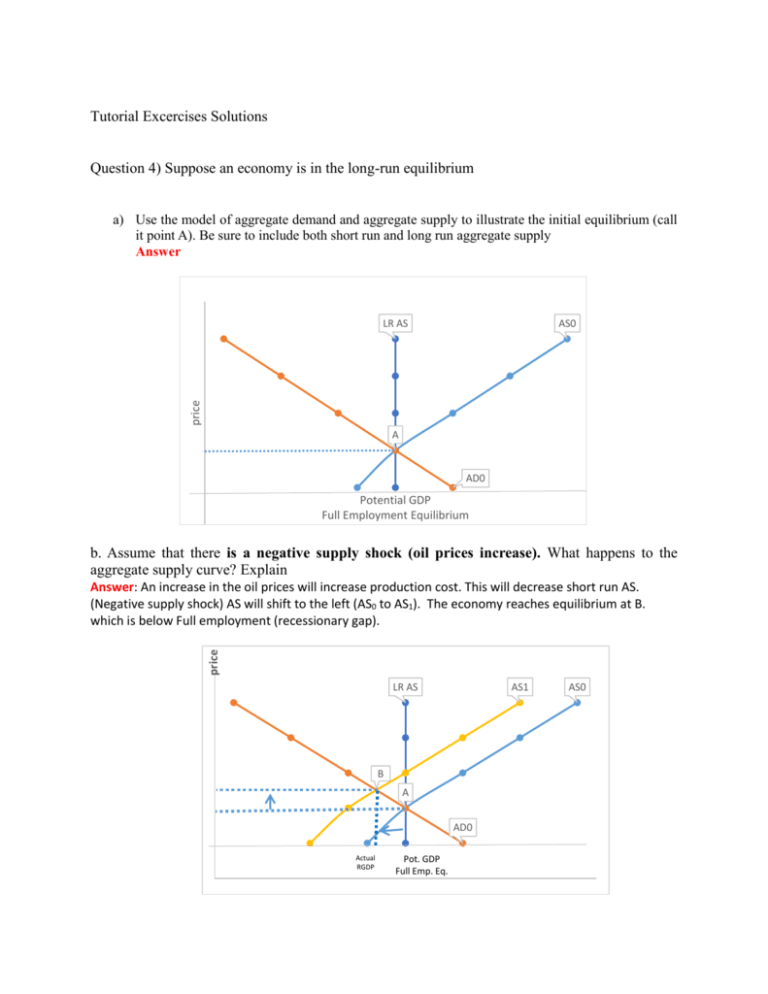
Tutorial Excercises Solutions Question 4) Suppose an economy is in the long-run equilibrium a) Use the model of aggregate demand and aggregate supply to illustrate the initial equilibrium (call it point A). Be sure to include both short run and long run aggregate supply Answer AS0 price LR AS A AD0 Potential GDP Full Employment Equilibrium b. Assume that there is a negative supply shock (oil prices increase). What happens to the aggregate supply curve? Explain price Answer: An increase in the oil prices will increase production cost. This will decrease short run AS. (Negative supply shock) AS will shift to the left (AS0 to AS1). The economy reaches equilibrium at B. which is below Full employment (recessionary gap). LR AS AS1 B A AD0 Actual RGDP Pot. GDP Full Emp. Eq. AS0 c) Use your diagram to show that happens to output and the price level when the economy moves from the initial to the new short run equilibrium (call it point B) Answer: In short run equilibrium move from point A to B. Real GDP (Aggregate output) will decrease and unemployment rate will increase (Recessionary gap). d) Now show the new long run equilibrium (call it point C). What causes the economy to move from point B to point C? Explain. Answer: In the long run if no action is taken, because output decreases demand for labor also decreases. When demand for labor decreases without a change in supply of labor than wages will decreases. This will decrease cost of production then short run AS will increase (shift to the right; from AS1 back to AS0) to the original full employment position (point A). If policy actions are taken (for example expansionary fiscal policy; lower tax rate or increase G, or monetary policy; increase Money supply) AD will shift to the right (AD0 to AD1) and economy returns to the full employment at a higher price level (from point A to C). price LR AS AS1 C B A AD0 Pot. GDP Full Emp. Eg. AD1 AS0 Question 5. Suppose an economy is in long-run equilibrium. a) Use the model of aggregate demand and aggregate supply to illustrate the initial equilibrium (call it point A). Be sure to include both short run and long run aggregate supply. Answer price LR AS A AD0 Pot GDP Full Emp. Eg. b) If the Central Bank increases the money supply. What happens to the aggregate demand curve? Explain. Answer: Increase in money supply shifts AD to the right (AD0 to AD1). Increase in Ms--- i rate will decrease ---- C and I will increase ---- AD will increase (shit to the right to AD1). price LR AS A AS0 B AD0 Pot. GDP Full Emp.Eq. AD1 c) What happens to the level of output and the price level in the short run? Use your diagram to illustrate how the economy moves from the initial to the new short-run equilibrium (Point B) Answer: In the short run economy move from point A to point B and it has rising in output and price level (Inflationary gap). d) What happens to the level of output and price level in the long run? What causes the economy move from point B to point C (long run equilibrium?) Answer: In the long run wage adjustment (increase due to the increase in price level) decrease short run AS; shifts AS to the left (AS0 to AS1). It cause increasing in price level but reducing real output until the economy returns to the initial level of output (from point A to C). LR AS AS1 price C B A AD0 Pot. GDP Full Emp. Eq. AD1 AS0


