Worksheet - People Server at UNCW
advertisement
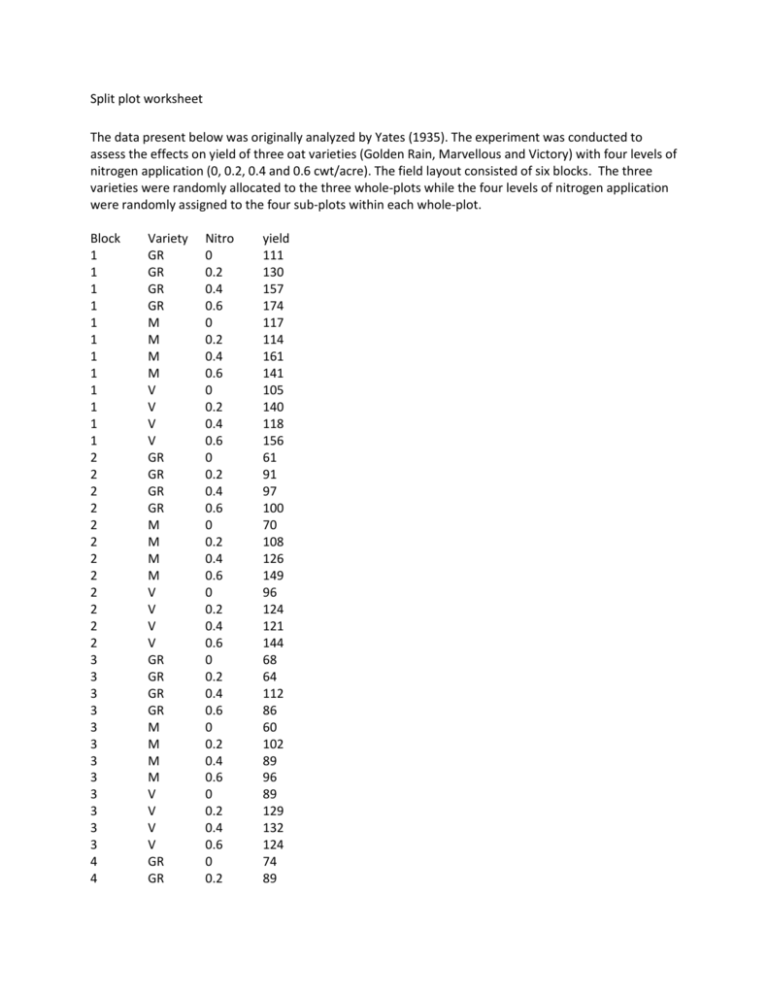
Split plot worksheet The data present below was originally analyzed by Yates (1935). The experiment was conducted to assess the effects on yield of three oat varieties (Golden Rain, Marvellous and Victory) with four levels of nitrogen application (0, 0.2, 0.4 and 0.6 cwt/acre). The field layout consisted of six blocks. The three varieties were randomly allocated to the three whole-plots while the four levels of nitrogen application were randomly assigned to the four sub-plots within each whole-plot. Block 1 1 1 1 1 1 1 1 1 1 1 1 2 2 2 2 2 2 2 2 2 2 2 2 3 3 3 3 3 3 3 3 3 3 3 3 4 4 Variety GR GR GR GR M M M M V V V V GR GR GR GR M M M M V V V V GR GR GR GR M M M M V V V V GR GR Nitro 0 0.2 0.4 0.6 0 0.2 0.4 0.6 0 0.2 0.4 0.6 0 0.2 0.4 0.6 0 0.2 0.4 0.6 0 0.2 0.4 0.6 0 0.2 0.4 0.6 0 0.2 0.4 0.6 0 0.2 0.4 0.6 0 0.2 yield 111 130 157 174 117 114 161 141 105 140 118 156 61 91 97 100 70 108 126 149 96 124 121 144 68 64 112 86 60 102 89 96 89 129 132 124 74 89 4 4 4 4 4 4 4 4 4 4 5 5 5 5 5 5 5 5 5 5 5 5 6 6 6 6 6 6 6 6 6 6 6 6 GR GR M M M M V V V V GR GR GR GR M M M M V V V V GR GR GR GR M M M M V V V V 0.4 0.6 0 0.2 0.4 0.6 0 0.2 0.4 0.6 0 0.2 0.4 0.6 0 0.2 0.4 0.6 0 0.2 0.4 0.6 0 0.2 0.4 0.6 0 0.2 0.4 0.6 0 0.2 0.4 0.6 81 122 64 103 132 133 70 89 104 117 62 90 100 116 80 82 94 126 63 70 109 99 53 74 118 113 89 82 86 104 97 99 119 121 a. Write the split plot model (assume Variety and Nitrogen are fixed effects). b. Fit the model in part a, and perform appropriate hypotheses. c. Assume Nitrogen is a random effect and rewrite the model and redo the analysis (perform appropriate hypothesis test, use the default method, REML). Give the estimates of covariance. 2. There are three bacterial inoculation treatments applied to two cultivars of grasses (A and B) and the dry weight yield is recorded as the response. The factor CULT (cultivar) is applied to the main plot and the factor INOC (inoculation) is applied randomly to the subplots. The levels of INOC are CON for control, LIV for live and DEA for dead. The data is shown below. Block 1 1 1 1 1 1 2 2 2 2 2 2 3 3 3 3 3 3 4 4 4 4 4 4 CULT A A A B B B A A A B B B A A A B B B A A A B B B INOC CON DEA LIV CON DEA LIV CON DEA LIV CON DEA LIV CON DEA LIV CON DEA LIV CON DEA LIV CON DEA LIV DRYWT 27.4 29.7 34.5 29.4 32.5 34.4 28.9 28.7 33.4 28.7 32.4 36.4 28.6 29.7 32.9 27.2 29.1 32.6 26.7 28.9 31.8 26.8 28.6 30.7 d. Write the split plot model (assume INOC and CULT are fixed effects). e. Fit the model in part a, and perform appropriate hypotheses. f. Assume CULT is a random effect and rewrite the model and redo the analysis (perform appropriate hypothesis test, use the default method, REML). Give the estimates of covariance.


