August 2015 - Department of Agriculture
advertisement
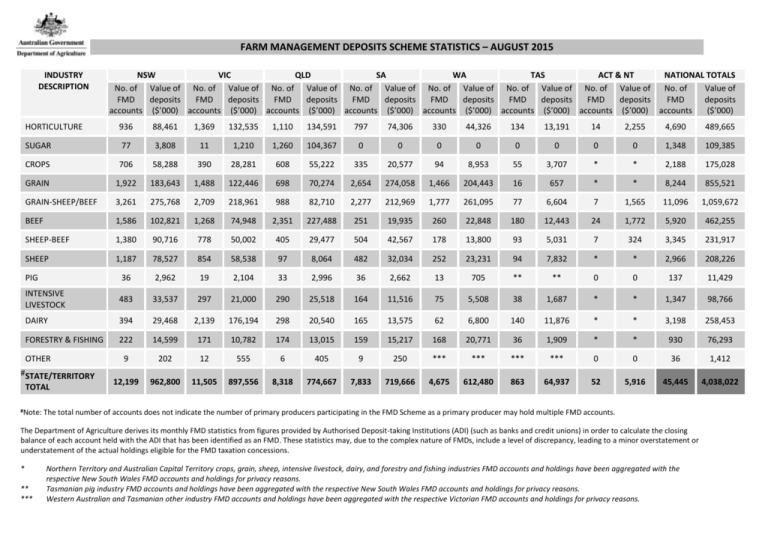
FARM MANAGEMENT DEPOSITS SCHEME STATISTICS – AUGUST 2015 INDUSTRY DESCRIPTION NSW VIC QLD SA WA TAS ACT & NT NATIONAL TOTALS No. of Value of No. of Value of No. of Value of No. of Value of No. of Value of No. of Value of No. of Value of No. of Value of FMD deposits FMD deposits FMD deposits FMD deposits FMD deposits FMD deposits FMD deposits FMD deposits accounts ($’000) accounts ($’000) accounts ($’000) accounts ($’000) accounts ($’000) accounts ($’000) accounts ($’000) accounts ($’000) HORTICULTURE 936 88,461 1,369 132,535 1,110 134,591 797 74,306 330 44,326 134 13,191 14 2,255 4,690 489,665 SUGAR 77 3,808 11 1,210 1,260 104,367 0 0 0 0 0 0 0 0 1,348 109,385 CROPS 706 58,288 390 28,281 608 55,222 335 20,577 94 8,953 55 3,707 * * 2,188 175,028 GRAIN 1,922 183,643 1,488 122,446 698 70,274 2,654 274,058 1,466 204,443 16 657 * * 8,244 855,521 GRAIN-SHEEP/BEEF 3,261 275,768 2,709 218,961 988 82,710 2,277 212,969 1,777 261,095 77 6,604 7 1,565 11,096 1,059,672 BEEF 1,586 102,821 1,268 74,948 2,351 227,488 251 19,935 260 22,848 180 12,443 24 1,772 5,920 462,255 SHEEP-BEEF 1,380 90,716 778 50,002 405 29,477 504 42,567 178 13,800 93 5,031 7 324 3,345 231,917 SHEEP 1,187 78,527 854 58,538 97 8,064 482 32,034 252 23,231 94 7,832 * * 2,966 208,226 PIG 36 2,962 19 2,104 33 2,996 36 2,662 13 705 ** ** 0 0 137 11,429 INTENSIVE LIVESTOCK 483 33,537 297 21,000 290 25,518 164 11,516 75 5,508 38 1,687 * * 1,347 98,766 DAIRY 394 29,468 2,139 176,194 298 20,540 165 13,575 62 6,800 140 11,876 * * 3,198 258,453 FORESTRY & FISHING 222 14,599 171 10,782 174 13,015 159 15,217 168 20,771 36 1,909 * * 930 76,293 9 202 12 555 6 405 9 250 *** *** *** *** 0 0 36 1,412 12,199 962,800 11,505 897,556 8,318 774,667 7,833 719,666 4,675 612,480 863 64,937 52 5,916 45,445 4,038,022 OTHER # STATE/TERRITORY TOTAL #Note: The total number of accounts does not indicate the number of primary producers participating in the FMD Scheme as a primary producer may hold multiple FMD accounts. The Department of Agriculture derives its monthly FMD statistics from figures provided by Authorised Deposit-taking Institutions (ADI) (such as banks and credit unions) in order to calculate the closing balance of each account held with the ADI that has been identified as an FMD. These statistics may, due to the complex nature of FMDs, include a level of discrepancy, leading to a minor overstatement or understatement of the actual holdings eligible for the FMD taxation concessions. * ** *** Northern Territory and Australian Capital Territory crops, grain, sheep, intensive livestock, dairy, and forestry and fishing industries FMD accounts and holdings have been aggregated with the respective New South Wales FMD accounts and holdings for privacy reasons. Tasmanian pig industry FMD accounts and holdings have been aggregated with the respective New South Wales FMD accounts and holdings for privacy reasons. Western Australian and Tasmanian other industry FMD accounts and holdings have been aggregated with the respective Victorian FMD accounts and holdings for privacy reasons.
