Inferring population decline and expansion from
advertisement
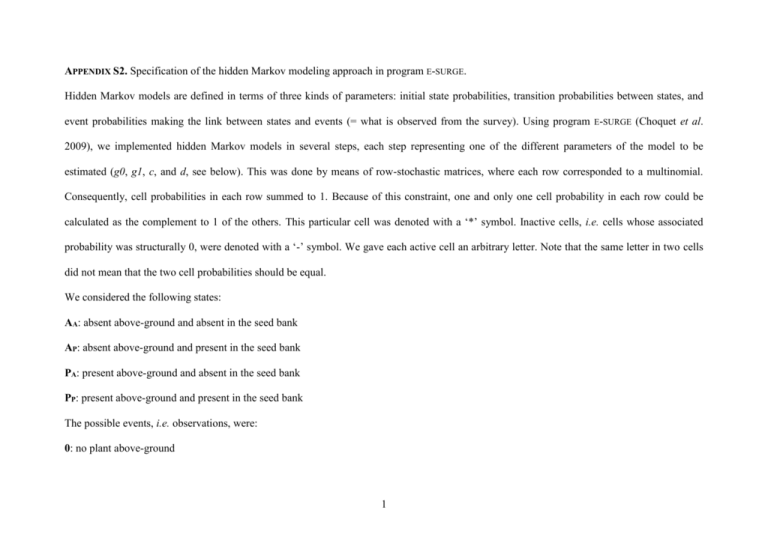
APPENDIX S2. Specification of the hidden Markov modeling approach in program E-SURGE. Hidden Markov models are defined in terms of three kinds of parameters: initial state probabilities, transition probabilities between states, and event probabilities making the link between states and events (= what is observed from the survey). Using program E-SURGE (Choquet et al. 2009), we implemented hidden Markov models in several steps, each step representing one of the different parameters of the model to be estimated (g0, g1, c, and d, see below). This was done by means of row-stochastic matrices, where each row corresponded to a multinomial. Consequently, cell probabilities in each row summed to 1. Because of this constraint, one and only one cell probability in each row could be calculated as the complement to 1 of the others. This particular cell was denoted with a ‘*’ symbol. Inactive cells, i.e. cells whose associated probability was structurally 0, were denoted with a ‘-’ symbol. We gave each active cell an arbitrary letter. Note that the same letter in two cells did not mean that the two cell probabilities should be equal. We considered the following states: AA: absent above-ground and absent in the seed bank AP: absent above-ground and present in the seed bank PA: present above-ground and absent in the seed bank PP: present above-ground and present in the seed bank The possible events, i.e. observations, were: 0: no plant above-ground 1 1: plant above-ground We used the following symbols for the model parameters: Y: initial state probability g0: probability that seeds produced at t give rise to at least one seedling between t and t +1 g1: probability that seeds having entered the seed bank at t-1 produce at least one seedling between t and t +1 c: probability of a patch to carry at least one seedling following a colonization event between t and t +1 d: probability of all seedlings from any origin dying due to the occurrence of a disturbance taking place between t and t +1 Initial state probabilities: AA AP PA PP Y Y Y * Transition probabilities: Note that because g0, g1 and c were independent in our mechanistic model, step1, step 2 and step 3 are interchangeable. 2 STEP 1: g0, seedlings arising between t and t +1 from seeds produced at t – Seedling emergence is denoted with ‘g0’, whereas no seedling emergence is denoted with ‘ng0’. AA AP PAg0 PAng0 PPg0 PPng0 AA * - - - - - AP - * - - - - PA - - g0 1-g0 - - PP - - - - g0 1-g0 STEP 2: g1, seedlings arising between t and t +1 from the seed bank – Seedling emergence is denoted with ‘g1’, whereas no seedling emergence is denoted with ‘ng1’. AA APg1 APng1 PAg0 AA * - - - AP - g1 1-g1 PAg0 - - PAng0 - PPg0 PPng0 PAng0 PPg0,g1 PPg0,ng1 PPng0,g1 PPng0,ng1 - - - - - - - - - - - - * - - - - - - - - * - - - - - - - - - g1 1-g1 - - - - - - - - - g1 1-g1 3 STEP 3: c, seedlings arising between t and t +1 from the migrant seeds – Seedling emergence is denoted with ‘c’, whereas no seedling emergence is denoted with ‘nc’. AAc AAnc APg1,c APg1,nc AA c 1-c - - APg1 - - c APng1 - - PAg0 - PAng0 APng1,c APng1,nc PAg0,c PAg0,nc PAng0,c PAng0,nc PPg0,g1,c PPg0,g1,nc PPg0,ng1,c PPg0,ng1,nc - - - - - - - - - - - 1-c - - - - - - - - - - - - c 1-c - - - - - - - - - - - - c 1-c - - - - - - - - - - - - c 1-c - PPg0,g1 - - - - - - - - - - PPg0,ng1 - - - - - - - - - PPng0,g1 - - - - - - - - PPng0,ng1 - - - - - - - - PPng0,ng1,c PPng0,ng1,nc - - - - - - - - - - - - - - - - - - - - - - - - - c 1-c - - - - - - - - - c 1-c - - - - - - - - - - c 1-c - - - - - - - - - - c 1-c 4 PPng0,g1,c PPng0,g1,nc STEP 4: d, probability of all seedlings from any origin dying due to the occurrence of a disturbance taking place between t and t + 1. The occurrence of a disturbance is denoted with ‘d’, whereas the absence of disturbance is denoted ‘nd’. AA AP PA PP AAc d - 1-d - AAnc * - - - APg1,c d - 1-d - APg1,nc d - 1-d - APng1,c d - 1-d - APng1,nc * - - - PAg0,c - d - 1-d PAg0,nc - d - 1-d PAng0,c - d - 1-d PAng0,nc - * - - PPg0,g1,c - d - 1-d PPg0,g1,nc - d - 1-d PPg0,ng1,c - d - 1-d PPg0,ng1,nc - d - 1-d PPng0,g1,c - d - 1-d PPng0,g1,nc - d - 1-d PPng0,ng1,c - d - 1-d PPng0,ng1,nc - * - - Reference Choquet, R., Rouan, L., Pradel, R. (2009) Program E–SURGE: a software application for fitting multievent models. Modeling demographic processes in marked populations (eds D.L. Thomson, E.G. Cooch & M.J. Conroy). pp 845–865. Springer, Berlin. 5

