Intro to Quadratics Graphically from Lines
advertisement
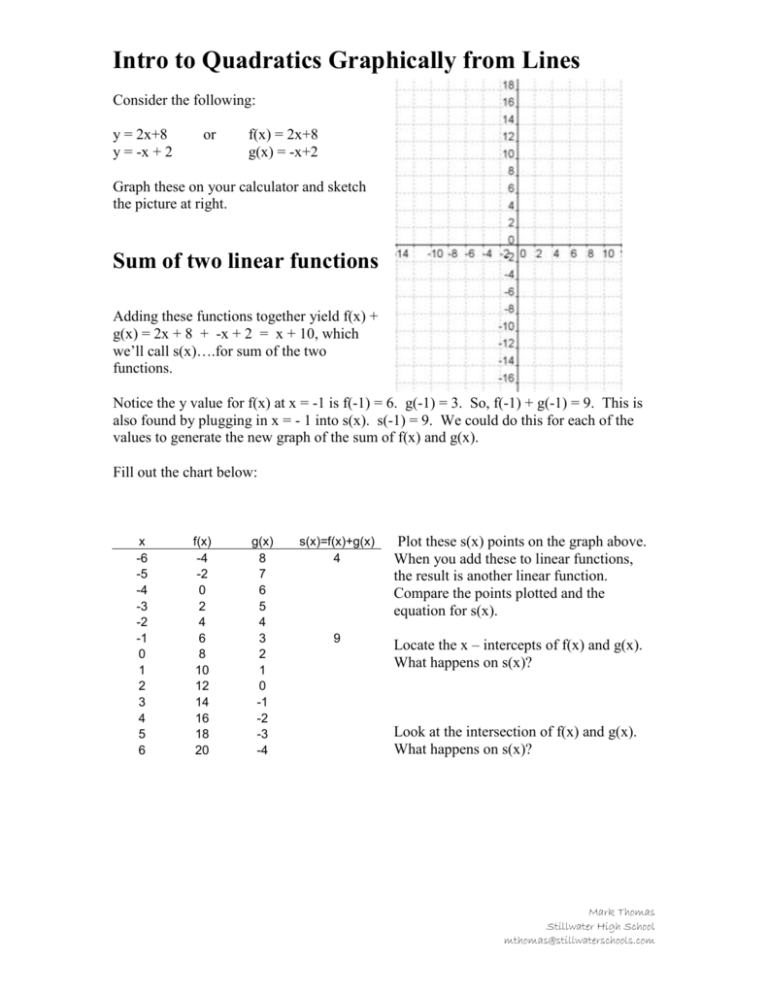
Intro to Quadratics Graphically from Lines Consider the following: y = 2x+8 y = -x + 2 or f(x) = 2x+8 g(x) = -x+2 Graph these on your calculator and sketch the picture at right. Sum of two linear functions Adding these functions together yield f(x) + g(x) = 2x + 8 + -x + 2 = x + 10, which we’ll call s(x)….for sum of the two functions. Notice the y value for f(x) at x = -1 is f(-1) = 6. g(-1) = 3. So, f(-1) + g(-1) = 9. This is also found by plugging in x = - 1 into s(x). s(-1) = 9. We could do this for each of the values to generate the new graph of the sum of f(x) and g(x). Fill out the chart below: x -6 -5 -4 -3 -2 -1 0 1 2 3 4 5 6 f(x) -4 -2 0 2 4 6 8 10 12 14 16 18 20 g(x) 8 7 6 5 4 3 2 1 0 -1 -2 -3 -4 s(x)=f(x)+g(x) 4 Plot these s(x) points on the graph above. When you add these to linear functions, the result is another linear function. Compare the points plotted and the equation for s(x). 9 Locate the x – intercepts of f(x) and g(x). What happens on s(x)? Look at the intersection of f(x) and g(x). What happens on s(x)? Mark Thomas Stillwater High School mthomas@stillwaterschools.com Product of two linear functions Now we wish to multiply f(x) and g(x). We will call it p(x) = f(x)*g(x) for product. p(-3) = f(-3)*g(-3) = (2)(5) = 10. We could multiply through the chart again and plot the points. x -6 -5 -4 -3 -2 -1 0 1 2 3 4 5 6 f(x) -4 -2 0 2 4 6 8 10 12 14 16 18 20 g(x) 8 7 6 5 4 3 2 1 0 -1 -2 -3 -4 s(x)=f(x)+g(x) 4 5 6 7 8 9 10 11 12 13 14 15 16 p(x)=f(x)*g(x) What happens to the function values on p(x) compared to s(x)? 10 Plot the points for p(x) for x values from -5 to 3. This shape is called a parabola and is given by a quadratic function. What do you observe for the x-intercepts for f(x) and g(x)? What happens when f(x) = g(x)? What are the coordinates for the highest point (maximum) of the parabola? How does the x-value compare to the x-intercepts of f(x) and g(x)? What must be true about f(x) and g(x) in order for p(x)…. to be positive? (above the x-axis) to be negative? (below the x-axis) to be zero? (on the x-axis) to have a minimum point instead of a maximum point? Mark Thomas Stillwater High School mthomas@stillwaterschools.com Summary Distributing (foiling) f(x)*g(x) = (2x + 8)(-x + 2) = -2x2 + 4x – 8x + 16 = -2x2 – 4x + 16. If y = ax2 + bx + c, then c = 16. What is special about this on the graph? The vertex is the maximum (or minimum) of the parabola. b It is found by x . How do you find 2a the y value? The zeros (x-intercepts) of the parabola are the x-intercepts of the linear pieces that are multiplied to give the quadratic. Extension Draw two lines where the multiplication involves two negatives to get a positive product. Draw two lines where the parabola opens upward. What must be true about the lines in order for the parabola to open upward? Mark Thomas Stillwater High School mthomas@stillwaterschools.com
