Supplemental Content - JACC: Clinical Electrophysiology
advertisement
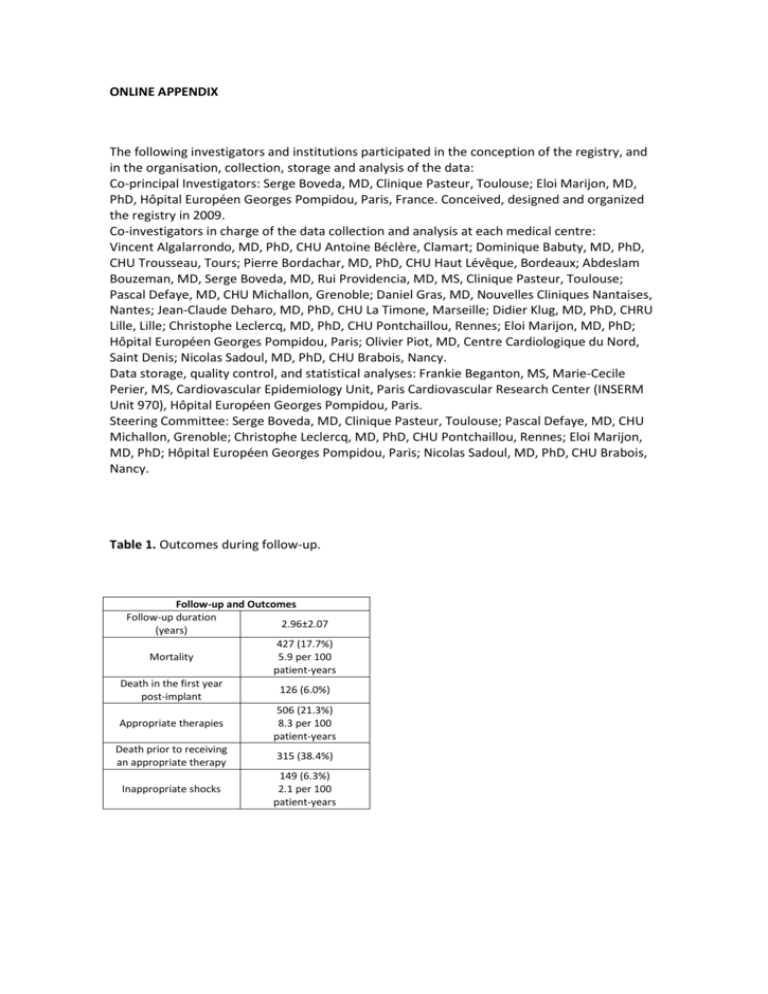
ONLINE APPENDIX The following investigators and institutions participated in the conception of the registry, and in the organisation, collection, storage and analysis of the data: Co-principal Investigators: Serge Boveda, MD, Clinique Pasteur, Toulouse; Eloi Marijon, MD, PhD, Hôpital Européen Georges Pompidou, Paris, France. Conceived, designed and organized the registry in 2009. Co-investigators in charge of the data collection and analysis at each medical centre: Vincent Algalarrondo, MD, PhD, CHU Antoine Béclère, Clamart; Dominique Babuty, MD, PhD, CHU Trousseau, Tours; Pierre Bordachar, MD, PhD, CHU Haut Lévêque, Bordeaux; Abdeslam Bouzeman, MD, Serge Boveda, MD, Rui Providencia, MD, MS, Clinique Pasteur, Toulouse; Pascal Defaye, MD, CHU Michallon, Grenoble; Daniel Gras, MD, Nouvelles Cliniques Nantaises, Nantes; Jean-Claude Deharo, MD, PhD, CHU La Timone, Marseille; Didier Klug, MD, PhD, CHRU Lille, Lille; Christophe Leclercq, MD, PhD, CHU Pontchaillou, Rennes; Eloi Marijon, MD, PhD; Hôpital Européen Georges Pompidou, Paris; Olivier Piot, MD, Centre Cardiologique du Nord, Saint Denis; Nicolas Sadoul, MD, PhD, CHU Brabois, Nancy. Data storage, quality control, and statistical analyses: Frankie Beganton, MS, Marie-Cecile Perier, MS, Cardiovascular Epidemiology Unit, Paris Cardiovascular Research Center (INSERM Unit 970), Hôpital Européen Georges Pompidou, Paris. Steering Committee: Serge Boveda, MD, Clinique Pasteur, Toulouse; Pascal Defaye, MD, CHU Michallon, Grenoble; Christophe Leclercq, MD, PhD, CHU Pontchaillou, Rennes; Eloi Marijon, MD, PhD; Hôpital Européen Georges Pompidou, Paris; Nicolas Sadoul, MD, PhD, CHU Brabois, Nancy. Table 1. Outcomes during follow-up. Follow-up and Outcomes Follow-up duration 2.96±2.07 (years) 427 (17.7%) Mortality 5.9 per 100 patient-years Death in the first year 126 (6.0%) post-implant 506 (21.3%) Appropriate therapies 8.3 per 100 patient-years Death prior to receiving 315 (38.4%) an appropriate therapy 149 (6.3%) Inappropriate shocks 2.1 per 100 patient-years Table 2. Accuracy of the risk score regarding death during the first year after implant. Number of Risk Factors ≥1 ≥2 ≥3 ≥4 ≥5 Number of Risk Factors ≥1 ≥2 ≥3 ≥4 ≥5 General Sample PPV* 6.8% 8.5% 11.9% 15.7% 20.0% NPV* 98.9% 98.3% 97.2% 95.7% 94.3% Sens 97.6% 89.7% 70.6% 40.5% 9.5% Ischemic Cardiomyopathy Spec 14.1% 38.7% 66.5% 86.1% 96.9% PPV 7.9% 9.9% 13.3% 16.2% 18.9% NPV 99.0% 98.0% 96.9% 95.1% 93.7% Dilated Cardiomyopathy PPV 5.2% 6.6% 9.4% 14.0% 14.3% NPV 98.4% 98.9% 95.5% 96.7% 95.5% Sens 97.5% 87.7% 69.1% 38.3% 8.6% Spec 18.4% 43.3% 67.9% 85.9% 97.4% Sens 97.6% 92.9% 71.4% 42.9% 11.9% Spec 7.8% 32.1% 64.2% 86.3% 96.3% CRT-D PPV 8.5% 9.6% 12.5% 15.7% 16.9% NPV 100% 98.8% 96.4% 94.1% 92.1% Sens 100% 97.9% 80.7% 47.3% 11.8% Spec 1.28% 16.0% 48.1% 76.8% 94.7% Legend: PPV = positive predictive value; NPV = negative predictive value; Sens = Sensitivity; Spec = Specificity. * Note: PPV refers to patients with values equal or above and NPV to those with values below the number of risk factors. Table 3. Discriminative capability of the Goldenberg risk score in patients with non-CRT ICDs. Patients implanted with ICD c-statistic Endpoint 95% CI 0.603 Mortality 0.552-0.654 0.486 Appropriate therapies 0.446-0.526 Death in the first year 0.698 post-implant 0.602-0.795 Death prior to receiving 0.604 an appropriate therapy 0.539-0.669 P <0.001 0.492 <0.001 0.002 Table 4. Analysis of the variables composing the Goldenberg risk score in patients with CRT-Ds and Non-CRT ICDs and their impact on mortality. NYHA ≥ III age > 70 QRS > 120 AF eGFR < 60 CRT-D Univariate Multivariate HR P HR P 95%CI 95%CI 2.67 <0.001 2.27 <0.001 1.92-3.72 1.63-3.18 1.61 <0.001 1.27-2.04 0.98 0.930 0.64-1.50 1.71 <0.001 1.41 0.008 1.33-2.19 1.10-1.81 2.49 <0.001 2.21 <0.001 1.95-3.19 1.72-2.83 Non-CRT ICDs Univariate Multivariate HR P HR P 95%CI 95%CI 2.28 <0.001 2.05 <0.001 1.62-3.21 1.45-2.90 1.55 0.019 1.07-2.23 0.96 0.803 0.68-1.35 1.74 0.005 1.55 0.028 1.18-2.57 1.05-2.30 2.45 <0.001 2.28 <0.001 1.76-3.41 1.63-3.17 Table 5. Discriminative capability of the Goldenberg risk score in patients with CRT-Ds according to QRS duration. Patients implanted with CRT-D and QRS > 150ms c-statistic Endpoint P 95% CI 0.716 Mortality <0.001 0.670-0.762 0.504 Appropriate therapies 0.901 0.448-0.559 Death in the first year 0.714 <0.001 post-implant 0.645.783 Death prior to receiving 0.687 <0.001 an appropriate therapy 0.616-0.757 Patients implanted with CRT-D and QRS ≤ 150ms c-statistic Endpoint P 95% CI 0.651 Mortality <0.001 0.603-0.699 0.499 Appropriate therapies 0.973 0.444-0.544 Death in the first year 0.660 <0.001 post-implant 0.586-0.735 Death prior to receiving 0.637 <0.001 an appropriate therapy 0.567-0.706

