ICUC8_Paper 522 _ Francesco Pilla - TARA
advertisement
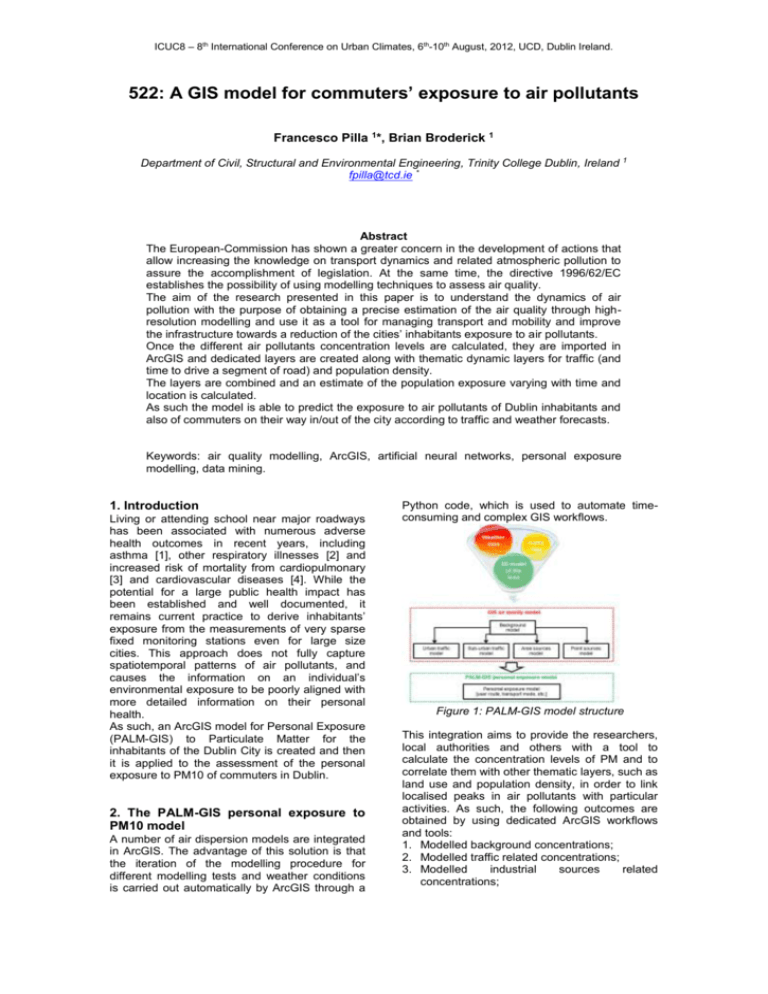
ICUC8 – 8th International Conference on Urban Climates, 6th-10th August, 2012, UCD, Dublin Ireland. 522: A GIS model for commuters’ exposure to air pollutants Francesco Pilla 1*, Brian Broderick 1 Department of Civil, Structural and Environmental Engineering, Trinity College Dublin, Ireland 1 fpilla@tcd.ie * Abstract The European-Commission has shown a greater concern in the development of actions that allow increasing the knowledge on transport dynamics and related atmospheric pollution to assure the accomplishment of legislation. At the same time, the directive 1996/62/EC establishes the possibility of using modelling techniques to assess air quality. The aim of the research presented in this paper is to understand the dynamics of air pollution with the purpose of obtaining a precise estimation of the air quality through highresolution modelling and use it as a tool for managing transport and mobility and improve the infrastructure towards a reduction of the cities’ inhabitants exposure to air pollutants. Once the different air pollutants concentration levels are calculated, they are imported in ArcGIS and dedicated layers are created along with thematic dynamic layers for traffic (and time to drive a segment of road) and population density. The layers are combined and an estimate of the population exposure varying with time and location is calculated. As such the model is able to predict the exposure to air pollutants of Dublin inhabitants and also of commuters on their way in/out of the city according to traffic and weather forecasts. Keywords: air quality modelling, ArcGIS, artificial neural networks, personal exposure modelling, data mining. 1. Introduction Living or attending school near major roadways has been associated with numerous adverse health outcomes in recent years, including asthma [1], other respiratory illnesses [2] and increased risk of mortality from cardiopulmonary [3] and cardiovascular diseases [4]. While the potential for a large public health impact has been established and well documented, it remains current practice to derive inhabitants’ exposure from the measurements of very sparse fixed monitoring stations even for large size cities. This approach does not fully capture spatiotemporal patterns of air pollutants, and causes the information on an individual’s environmental exposure to be poorly aligned with more detailed information on their personal health. As such, an ArcGIS model for Personal Exposure (PALM-GIS) to Particulate Matter for the inhabitants of the Dublin City is created and then it is applied to the assessment of the personal exposure to PM10 of commuters in Dublin. 2. The PALM-GIS personal exposure to PM10 model A number of air dispersion models are integrated in ArcGIS. The advantage of this solution is that the iteration of the modelling procedure for different modelling tests and weather conditions is carried out automatically by ArcGIS through a Python code, which is used to automate timeconsuming and complex GIS workflows. Figure 1: PALM-GIS model structure This integration aims to provide the researchers, local authorities and others with a tool to calculate the concentration levels of PM and to correlate them with other thematic layers, such as land use and population density, in order to link localised peaks in air pollutants with particular activities. As such, the following outcomes are obtained by using dedicated ArcGIS workflows and tools: 1. Modelled background concentrations; 2. Modelled traffic related concentrations; 3. Modelled industrial sources related concentrations; ICUC8 – 8th International Conference on Urban Climates, 6th-10th August, 2012, UCD, Dublin Ireland. 4. Modelled domestic sources related concentrations. The concentration levels are then combined in ArcGIS in order to obtain total concentrations at specific locations in Dublin to calculate the personal exposure of a commuter on his/her route from habitation to workplace using the PALM-GIS model (Figure 1). This ArcGIS extension is able to calculate the exposure of the commuter on the route according to the time spent on each link, which is function of the average speed on the same link. It is also possible to calculate the route from a starting point (the habitation) to a destination (the work place) which would minimise the exposure by using a cost function applied to the road network and its characteristics, such as the average speed and the pollutant concentration. Figure 2: Commuting route - bus Figure 3 and Figure 4 show the measured and modelled PM10 concentrations respectively. 3. Validation of the model A number of significant examples were selected to be modelled and used as validation tests for the model. For completeness purpose, the commuters’ datasets to be modelled and analysed are selected with different transport modes and routes through the city. The following examples are chosen: 1. Bus: southbound route to Trinity College with bus; 2. Bicycle: westbound route to Trinity College with bicycle; 3. Walk: northbound route from Trinity College. The measurements are carried out with an Aerocet-531 mass particle counter, which averages the measurements over two minute periods; these data are then combined with the positions recorded by the GPS unit, (which was carried by the commuter along with the PM10 monitoring device). 3.1 Commuting by bus The route goes through different air quality environments (Figure 2): The residential area, characterised by roads flanked by trees and low rise detached and semi-detached buildings with gardens; A heavily trafficked road (Rathmines Road), characterised by a building height to street width ratio which is typical of the “urban street canyons” and may lead to the generation of recirculation street vortexes; A park in an urban area, characterised by an open green area surrounded by heavily trafficked roads. Figure 3: Measured PM10 – bus Figure 4: Modelled PM10 - bus 3.2 Commuting by bicycle This route goes through very heterogeneous environments, which require completely different air pollutants dispersion modelling approaches (Figure 5): The residential area around Castleknock, characterised by roads flanked by trees and low rise detached and semi-detached buildings with gardens; The rural environment from the M50 Flyover and the residential area surrounding Phoenix Park, characterised by very sparse houses, open fields and trees along the road; The open park (Phoenix Park), characterised by open spaces with no buildings; The heavily trafficked road (the Quays), characterised by a ratio building height street width which is typical of the “urban street ICUC8 – 8th International Conference on Urban Climates, 6th-10th August, 2012, UCD, Dublin Ireland. canyons” and may lead to the generation of recirculation street vortexes; Figure 5: Commuting route - bicycle Figure 8: Commuting route - walking Figure 6 and Figure 7 show the measured and modelled PM10 concentrations respectively. Figure 9 and Figure 10 show the measured and modelled PM10 concentrations respectively. Figure 6: Measured PM10 - bicycle Figure 9: Measured PM10 - walk Figure 7: Modelled PM10 - bicycle Figure 10: Modelled PM10 - walk 3.3 Walking The route goes through an urban environment, with a building height to street width ratio which is typical of “urban street canyons”. This test case was also chosen because it was carried out around 6pm, which is generally “rush hour” in Dublin and therefore a period where there is likely to be high exposure to road traffic pollutants timeframe for pedestrians in that part of the city (Figure 8): 4. Performances of the model The measured and modelled data are averaged over 5 minute periods in order to minimise the influence of noise and short-term variations between the compared two averaged datasets. The PALM-GIS model reproduces with very high accuracy the measured levels for the three test cases, with a coefficient of correlation R2 which ranges between 0.74 and 0.96. Figure 11: Comparison between measured and modeled concentrations - bus ICUC8 – 8th International Conference on Urban Climates, 6th-10th August, 2012, UCD, Dublin Ireland. Table 1: calculated dose for measured (meas) and modelled (mod) data [µg]. Transport mode Bus Bicycle Walk Meas Mod 24.38 25.12 36.21 1.23 2.33 1.79 Ratio mod/meas 57.24 47.57 54.12 Figure 12: Correlation coefficient between measured and modeled concentrations - bus 5. Conclusions Figure 13: Comparison between measured and modeled concentrations – bicycle Figure 14: Correlation coefficient between measured and modeled concentrations - bicycle In personal exposure studies, inhalation is considered as a major route of exposure for an individual, who breathes in polluted air which enters the respiratory tract. Identification of the pollutant uptake by the respiratory system can determine how the resulting exposure contributes to the dose. In toxicology, dose may refer to the amount of a harmful agent to which an organism is exposed: as such, the mechanism of pollutant uptake by the respiratory system can be used to predict potential health impacts within the human population. It is clear from the results presented in the table above that the personal exposure model highly performs in predicting the inhaled dose for the individuals while commuting to work with four different transport modes. 6. Acknowledgements This project is founded by the Irish E.P.A. under the STRIVE Program. 7. References Figure 15: Comparison between measured and modeled concentrations – walk Figure 14: Correlation coefficient between measured and modeled concentrations - walk In order to have a better estimate of the performances of the personal exposure model for the test cases presented above, the dose is calculated for the measured and modelled data. The calculation is performed for each presented test case and the results are presented in the table below. [1] N. Matthew J, “Air pollution, health, and socioeconomic status: the effect of outdoor air quality on childhood asthma,” Journal of Health Economics, vol. 23, no. 6, pp. 12091236, 2004. [2] D. W. Dockery, and C. A. Pope, “Acute Respiratory Effects of Particulate Air Pollution,” Annual Review of Public Health, vol. 15, no. 1, pp. 107-132, 1994. [3] C. A. Pope, R. T. Burnett, M. J. Thun et al., “Lung Cancer, Cardiopulmonary Mortality, and Long-term Exposure to Fine Particulate Air Pollution,” JAMA: The Journal of the American Medical Association, vol. 287, no. 9, pp. 1132-1141, March 6, 2002, 2002. [4] C. A. Pope, R. T. Burnett, G. D. Thurston et al., “Cardiovascular Mortality and Long-Term Exposure to Particulate Air Pollution,” Circulation, vol. 109, no. 1, pp. 71-77, January 6/13, 2004, 2004.
