Thermoelectric_Cooler_Procedure_and_Background
advertisement
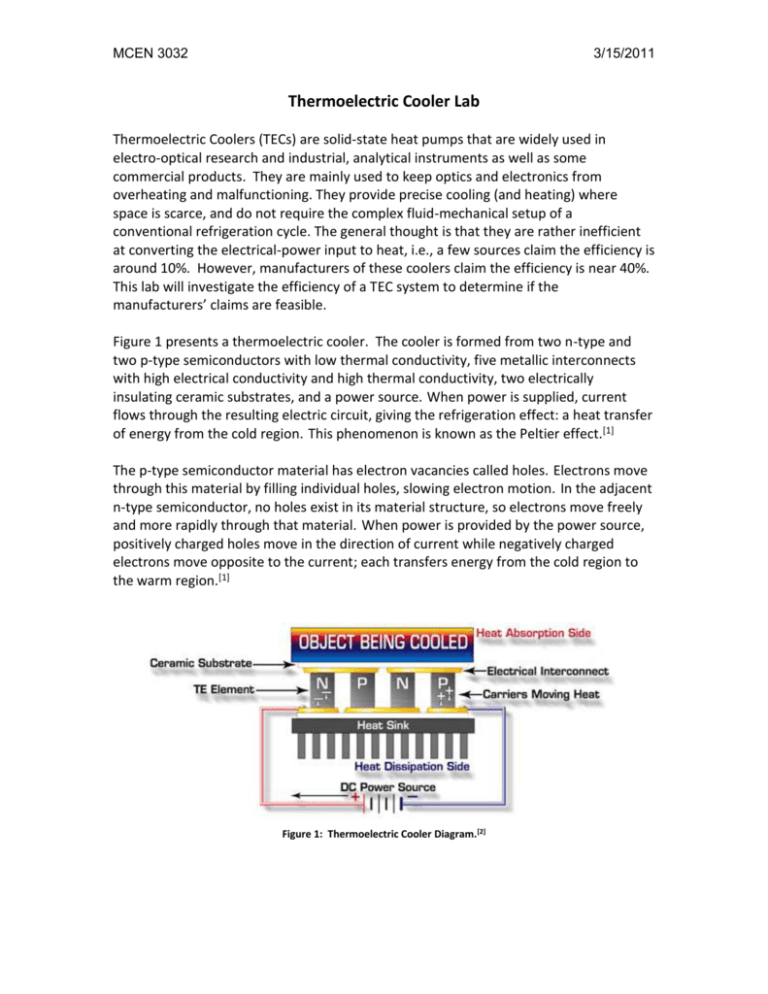
MCEN 3032 3/15/2011 Thermoelectric Cooler Lab Thermoelectric Coolers (TECs) are solid-state heat pumps that are widely used in electro-optical research and industrial, analytical instruments as well as some commercial products. They are mainly used to keep optics and electronics from overheating and malfunctioning. They provide precise cooling (and heating) where space is scarce, and do not require the complex fluid-mechanical setup of a conventional refrigeration cycle. The general thought is that they are rather inefficient at converting the electrical-power input to heat, i.e., a few sources claim the efficiency is around 10%. However, manufacturers of these coolers claim the efficiency is near 40%. This lab will investigate the efficiency of a TEC system to determine if the manufacturers’ claims are feasible. Figure 1 presents a thermoelectric cooler. The cooler is formed from two n-type and two p-type semiconductors with low thermal conductivity, five metallic interconnects with high electrical conductivity and high thermal conductivity, two electrically insulating ceramic substrates, and a power source. When power is supplied, current flows through the resulting electric circuit, giving the refrigeration effect: a heat transfer of energy from the cold region. This phenomenon is known as the Peltier effect.[1] The p-type semiconductor material has electron vacancies called holes. Electrons move through this material by filling individual holes, slowing electron motion. In the adjacent n-type semiconductor, no holes exist in its material structure, so electrons move freely and more rapidly through that material. When power is provided by the power source, positively charged holes move in the direction of current while negatively charged electrons move opposite to the current; each transfers energy from the cold region to the warm region.[1] Figure 1: Thermoelectric Cooler Diagram.[2] MCEN 3032 3/15/2011 Thermoelectric Cooler Circuits Background: The overall objective of this lab is to determine the efficiency and operational characteristics of a TEC using an experiment with a setup similar to the illustration in Figure 2. 5V and 12V Figure 2: Experimental set up (Part A). The TEC will be powered from a voltage supply, and by tracking the voltages and electrical input power, one can calculate the thermal efficiency of the TEC using heat balance equations. The experiments will be transient (time dependent), and, for one experiment, both masses (bodies) will be insulated from the environment (assume adiabatic when defined as insulated). For determining the temperatures of the hot and cold regions in parts A and B of the experiment a basic understanding of the circuits involved is needed. Fig.3. illustrates the circuit which provides the LabView VI with the voltage being supplied to the TEC for parts A and B of the experiment. MCEN 3032 3/15/2011 Figure 3: Visual Representation of circuit used to deliver the voltage input of TECS 1&2 to LabView. In Figure 3, VPower Supply is the voltage selected by the switch on the electrical box of the experiment (see Figure 6). R* is equal to 0.1 Ohm and serves as a current sensor. The current through R* may be found using the voltage measurements of V1 and V2. V1 and V2 represent the actual voltage drop across the 0.1 Ohm resistor. The TEC box represents the TEC that is connected between V2 and ground (V=0). The LabView VI displays V1 and V2 directly. In part A of the lab, the temperatures of the two heat bodies need to be determined using the resistance of a thermistor attached to each body. Figure 4 presents the voltage-divider circuit associated with the thermistors for part A. Figure 4: Voltage divider circuit used for determining the resistances of both the hot region and cold region thermistors. MCEN 3032 3/15/2011 Thermistor 1 is connected to the cold region of experiment A, and thermistor 2 measures the hot region. Knowing the voltage supplied, the voltage measured, and the resistor that serves as the upper leg of the voltage divider, the resistance of the thermistors can be calculated. Experimental Procedure: This experiment consists of two parts; Experiment A and Experiment B are illustrated in Fig.5. Figure 5: Illustration of the two different experimental set ups for the TEC The laboratory equipment used in this experiment is illustrated in Figure 6. MCEN 3032 3/15/2011 Figure 6: Visual representation of the Thermoelectric Cooler Lab Module Part A, 5V: 1. Connect the USB cable to the computer at a LabStation. 2. Open the NI Measurement and Automation Explorer (MAX) software. On the left side of the screen within the Devices and Interfaces tree, a NI USB 6008 device should be listed. Make sure this device is labeled as “Dev3,” and if it is not, re-label it to be “Dev3” (right click on the deviceRename). This is necessary for the LabVIEW program to work properly. 3. Plug in the 5V/12V power supply and turn it on via the switch on its back panel. 4. Open the Lab View VI: “Thermoelectric Cooler.VI” which is located in the H:\ITLL Documentation\ITLL Modules\Thermoelectric Cooler folder. 5. On the electrical box, set the voltage switch to 5V. Flip the experiment-selection switch is set to Experiment A. Start the VI and record data for 10 min. 6. Once you have collected 10 minutes of data, stop the VI. SAVE YOUR DATA! Set the experiment-selection switch to the middle (off) position. You will come back to Part A of the experiment after completing Part B, so remove the insulation from underneath experiment A and replace it with the aluminum plate. This is to help the temperature of the two bodies equilibrate. MCEN 3032 3/15/2011 Part B: 1. Set the voltage switch to 12V. 2. Flip the experiment-selection switch to Experiment B and start recording data with the LabVIEW VI. 3. Turn the temperature set screw (using provided screwdriver) on the controller so that the set point temperature equals 20C. Keep recoding data until steady state is reached. Adjust to 17.5C, wait for steady state, then 15C and finally 10C. 4. Once you have all the data and have been able to reach steady state for all temperatures, stop the VI. SAVE YOUR DATA! 5. Set the lab switch to the middle (off) position. Part A, 12V: 1. On the electrical box, set the voltage switch to 12V. Flip the experimentselection switch is set to Experiment A. Start the VI and record data for 10 min. 2. Once you have collected data for 10 minutes, stop the VI. SAVE YOUR DATA! Set the lab switch to the middle (off) position and turn off the power supply via the switch on the back. 3. Unplug the power supply and USB cable. Return the experiment to its storage rack. Data Analysis: Part A 1.1 Write down the overall heat balance in the system and state any assumptions. Expand all equations in detail, and explain you reasoning. 1.2 Convert the voltages for the two thermistors to temperatures using Figure 4 and information from the data sheet of the thermistor. 1.3 Discuss the results of the experiment in terms of: - The heating and cooling balance to input power - Ratio of cooling to heating for different times (1min, 2min, 5min, and 10min) 1.4 What are the uncertainties in this experiment? MCEN 3032 3/15/2011 Part B 2.1 Illustrate the energy balance in this setup, including the body of interest, the TEC and the heat sink. Assuming a constant temperature for body 1, write down the heat transfer equation between the ambient air and the body. How can you get a good approximation for the body surface temperature? 2.2 The typical application involves keeping the temperature in body 1 constant. Record the power supplied to the TEC, and calculate the heat flow into the body from the surrounding environment, Q, for the five different temperatures. 3.3 Find the ratio of the TEC input power to the heat transfer into the body, and discuss any relation to the body temperature. When is the TEC working hardest? 3.4 What are the uncertainties in this experiment? Lab References [1] Book [2] TEC Diagram, http://www.ferrotec.com/technology/thermoelectric/, March 15th ,2011
