Supplementary table 6a. Determinants of vaccine efficacy
advertisement
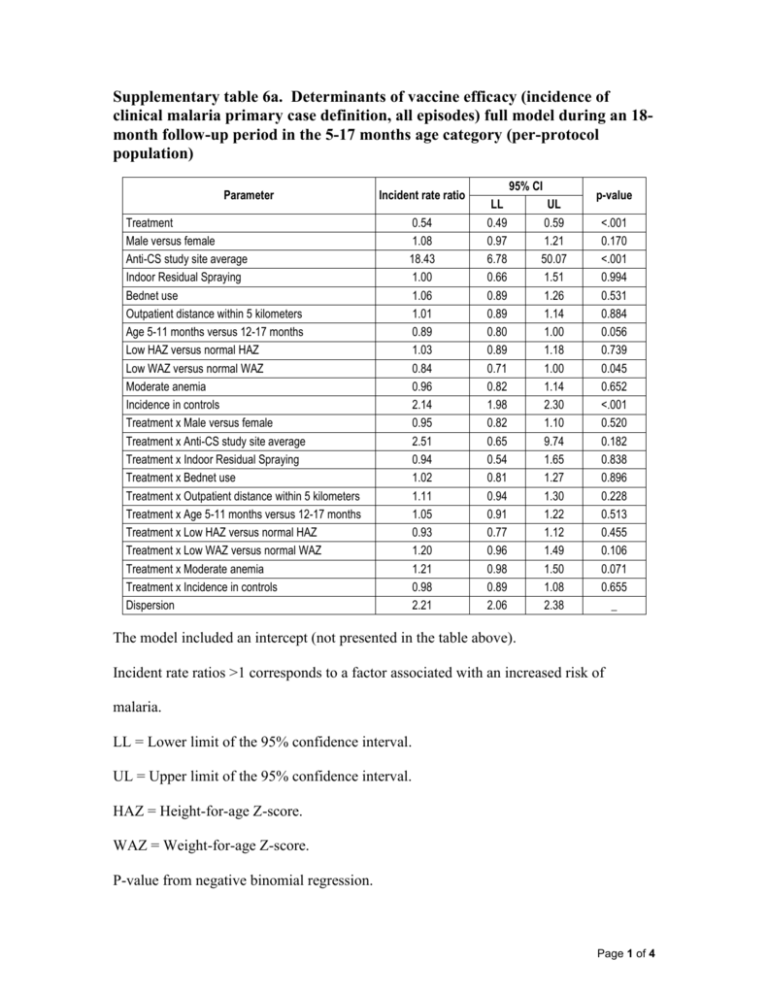
Supplementary table 6a. Determinants of vaccine efficacy (incidence of clinical malaria primary case definition, all episodes) full model during an 18month follow-up period in the 5-17 months age category (per-protocol population) Parameter Treatment Male versus female Anti-CS study site average Indoor Residual Spraying Bednet use Outpatient distance within 5 kilometers Age 5-11 months versus 12-17 months Low HAZ versus normal HAZ Low WAZ versus normal WAZ Moderate anemia Incidence in controls Treatment x Male versus female Treatment x Anti-CS study site average Treatment x Indoor Residual Spraying Treatment x Bednet use Treatment x Outpatient distance within 5 kilometers Treatment x Age 5-11 months versus 12-17 months Treatment x Low HAZ versus normal HAZ Treatment x Low WAZ versus normal WAZ Treatment x Moderate anemia Treatment x Incidence in controls Dispersion Incident rate ratio 0.54 1.08 18.43 1.00 1.06 1.01 0.89 1.03 0.84 0.96 2.14 0.95 2.51 0.94 1.02 1.11 1.05 0.93 1.20 1.21 0.98 2.21 95% CI LL 0.49 0.97 6.78 0.66 0.89 0.89 0.80 0.89 0.71 0.82 1.98 0.82 0.65 0.54 0.81 0.94 0.91 0.77 0.96 0.98 0.89 2.06 UL 0.59 1.21 50.07 1.51 1.26 1.14 1.00 1.18 1.00 1.14 2.30 1.10 9.74 1.65 1.27 1.30 1.22 1.12 1.49 1.50 1.08 2.38 p-value <.001 0.170 <.001 0.994 0.531 0.884 0.056 0.739 0.045 0.652 <.001 0.520 0.182 0.838 0.896 0.228 0.513 0.455 0.106 0.071 0.655 _ The model included an intercept (not presented in the table above). Incident rate ratios >1 corresponds to a factor associated with an increased risk of malaria. LL = Lower limit of the 95% confidence interval. UL = Upper limit of the 95% confidence interval. HAZ = Height-for-age Z-score. WAZ = Weight-for-age Z-score. P-value from negative binomial regression. Page 1 of 4 Supplementary table 6b. Determinants of vaccine efficacy (incidence of clinical malaria primary case definition, all episodes) final model during an 18-month follow-up period in the 5-17 months age category (per-protocol population) Parameter Incident rate ratio Treatment Male versus female Anti-CS study site average Indoor Residual Spraying Bednet use Outpatient distance within 5 kilometers Age 5-11 months versus 12-17 months Low HAZ versus. normal HAZ Low WAZ versus normal WAZ Moderate anemia Incidence in controls Treatment x Moderate anemia Dispersion 0.56 1.05 29.92 0.98 1.07 1.07 0.92 0.99 0.94 0.95 2.11 1.24 2.22 95% CI LL 0.52 0.98 15.22 0.74 0.96 0.99 0.85 0.90 0.84 0.80 2.01 1.01 2.07 UL 0.60 1.13 58.80 1.29 1.19 1.16 0.99 1.08 1.04 1.11 2.21 1.52 2.39 p-value <.001 0.168 <.001 0.864 0.246 0.097 0.021 0.742 0.228 0.502 <.001 0.041 _ The model included an intercept (not presented in the table above). The full model includes all treatment-covariate interaction and the final model was obtained by stepwise removal of non-significant (>0.05) interaction terms. Incident rate ratios >1 corresponds to a factor associated with an increased risk of malaria. LL = Lower limit of the 95% confidence interval. UL = Upper limit of the 95% confidence interval. HAZ = Height-for-age Z-score. WAZ = Weight-for-age Z-score. P-value from negative binomial regression. Page 2 of 4 Supplementary table 6c. Determinants of vaccine efficacy (incidence of clinical malaria primary case definition, all episodes) full model during an 18month follow-up period in the 6-12 weeks age category (per-protocol population) Parameter Incident rate ratio Treatment Male versus female Anti-CS study site average Indoor Residual Spraying Bednet use Outpatient distance within 5 kilometers Age 6 weeks versus 7-12 weeks Low HAZ versus normal HAZ Low WAZ versus normal WAZ Moderate anemia Incidence in controls Treatment x Male versus female Treatment x Anti-CS study site average Treatment x Indoor Residual Spraying Treatment x Bednet use Treatment x Outpatient distance within 5 kilometers Treatment x Age 6 weeks versus 7-12 weeks Treatment x Low HAZ versus normal HAZ Treatment x Low WAZ versus normal WAZ Treatment x Moderate anemia Treatment x Incidence in controls Dispersion 0.76 1.07 0.57 0.74 0.95 0.80 0.89 1.10 1.04 0.91 2.87 1.07 0.61 1.16 0.94 0.99 1.17 0.93 1.00 1.47 0.99 2.49 95% CI LL 0.69 0.93 0.33 0.44 0.75 0.69 0.78 0.92 0.80 0.50 2.65 0.90 0.31 0.62 0.69 0.82 0.99 0.75 0.72 0.73 0.90 2.29 UL 0.84 1.23 1.00 1.26 1.22 0.94 1.02 1.31 1.35 1.65 3.10 1.28 1.21 2.18 1.27 1.20 1.39 1.16 1.40 2.99 1.10 2.74 p-value <.001 0.336 0.051 0.271 0.717 0.005 0.103 0.305 0.765 0.750 <.001 0.420 0.154 0.636 0.675 0.931 0.070 0.521 0.981 0.284 0.902 _ The model included an intercept (not presented in the table above). Incident rate ratios >1 corresponds to a factor associated with an increased risk of malaria. LL = Lower limit of the 95% confidence interval. UL = Upper limit of the 95% confidence interval. HAZ = Height-for-age Z-score. WAZ = Weight-for-age Z-score. P-value from negative binomial regression. Page 3 of 4 Supplementary table 6d. Determinants of vaccine efficacy (incidence of clinical malaria primary case definition, all episodes) final model during an 18-month follow-up period in the 6-12 weeks age category (per-protocol population) Parameter Treatment Male versus female Anti-CS study site average Indoor Residual Spraying Bednet use Outpatient distance within 5 kilometers Age 6 weeks versus 7-12 weeks Low HAZ versus normal HAZ Low WAZ versus normal WAZ Moderate anemia Incidence in controls Dispersion Incident rate ratio 0.77 1.12 0.42 0.82 0.92 0.80 0.99 1.05 1.04 1.18 2.86 2.50 95% CI LL 0.71 1.03 0.30 0.62 0.80 0.73 0.91 0.95 0.89 0.86 2.73 2.29 UL 0.84 1.22 0.58 1.09 1.07 0.88 1.07 1.17 1.22 1.63 2.99 2.75 p-value <.001 0.007 <.001 0.174 0.284 <.001 0.768 0.365 0.605 0.301 <.001 _ The model included an intercept (not presented in the table above). The full model includes all treatment-covariate interaction and the final model was obtained by stepwise removal of non-significant (>0.05) interaction terms. Incident rate ratios >1 corresponds to a factor associated with an increased risk of malaria. LL = Lower limit of the 95% confidence interval. UL = Upper limit of the 95% confidence interval. HAZ = Height-for-age Z-score. WAZ = Weight-for-age Z-score. P-value from negative binomial regression. Page 4 of 4
