Classroom Problems
advertisement
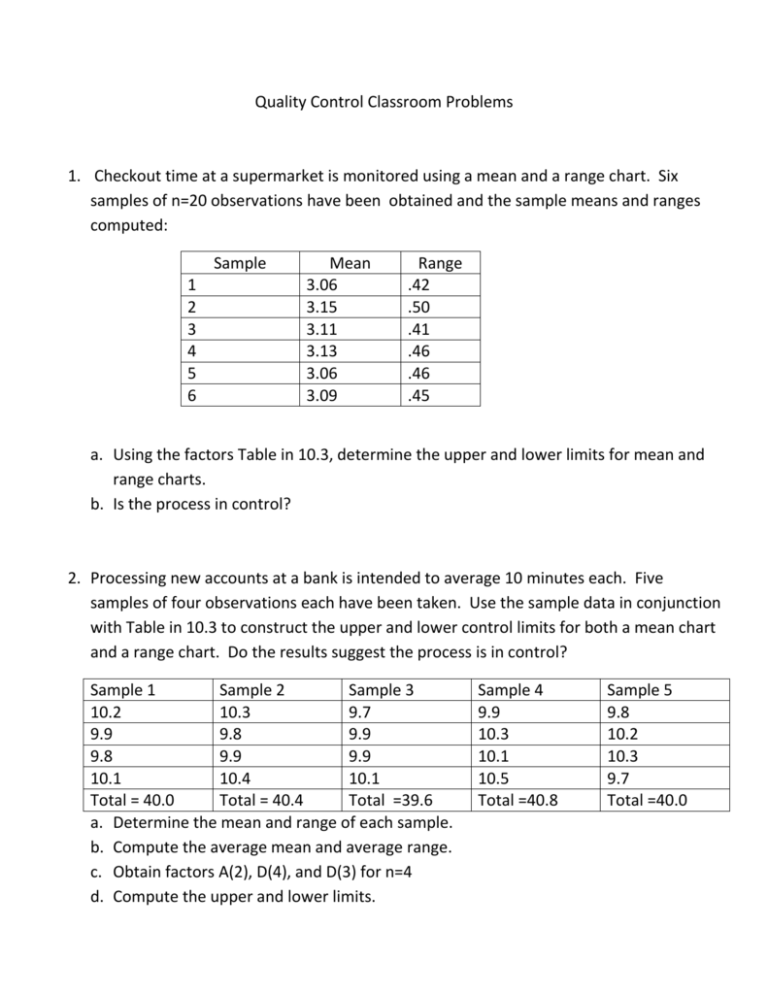
Quality Control Classroom Problems 1. Checkout time at a supermarket is monitored using a mean and a range chart. Six samples of n=20 observations have been obtained and the sample means and ranges computed: Sample 1 2 3 4 5 6 Mean 3.06 3.15 3.11 3.13 3.06 3.09 Range .42 .50 .41 .46 .46 .45 a. Using the factors Table in 10.3, determine the upper and lower limits for mean and range charts. b. Is the process in control? 2. Processing new accounts at a bank is intended to average 10 minutes each. Five samples of four observations each have been taken. Use the sample data in conjunction with Table in 10.3 to construct the upper and lower control limits for both a mean chart and a range chart. Do the results suggest the process is in control? Sample 1 Sample 2 Sample 3 10.2 10.3 9.7 9.9 9.8 9.9 9.8 9.9 9.9 10.1 10.4 10.1 Total = 40.0 Total = 40.4 Total =39.6 a. Determine the mean and range of each sample. b. Compute the average mean and average range. c. Obtain factors A(2), D(4), and D(3) for n=4 d. Compute the upper and lower limits. Sample 4 9.9 10.3 10.1 10.5 Total =40.8 Sample 5 9.8 10.2 10.3 9.7 Total =40.0 3. Hospital Admin inventories the quality of meals. Surveys 10 days with 1000 responses per day. Day 1 2 3 4 5 6 7 8 9 10 Total Unsatisfactory 74 42 64 80 40 50 65 70 40 75 600 Sample Size 1000 1000 1000 1000 1000 1000 1000 1000 1000 1000 10,000 Percentage .074 .042 .064 .080 .040 .050 .065 .070 .040 .075 a. Construct a P chart with a 95.4% confidence level. Z = 2, Sigma = 2 b. Is the process in control? 4. The postmaster of a small western town receives a certain number of complaints each day about mail delivery. Determine three-sigma control limits using the following data. Is the process in control? # 1 4 2 10 3 14 4 8 # = Number of complaints Z=3 5 9 6 6 7 5 8 12 9 13 10 7 11 6 12 4 13 2 14 10 Table 10.3 Number of Observations per Group (n) 2 3 4 5 6 7 8 9 10 11 12 13 14 15 16 17 18 19 20 Factors for X chart A(2) 1.88 1.02 .73 .58 .48 .42 .37 .34 .31 .29 .27 .25 .24 .22 .21 .20 .19 .19 .18 Factors for R chart Lower control limit D(3) 0 0 0 0 0 .08 .14 .18 .22 .26 .28 .31 .33 .35 .36 .38 .39 .40 .41 Factors for R chart Upper control limit D(4) 3.27 2.57 2.28 2.11 2.00 1.92 1.86 1.82 1.78 1.74 1.72 1.69 1.87 1.65 1.64 1.62 1.61 1.60 1.59
