Testing Learning Task
advertisement
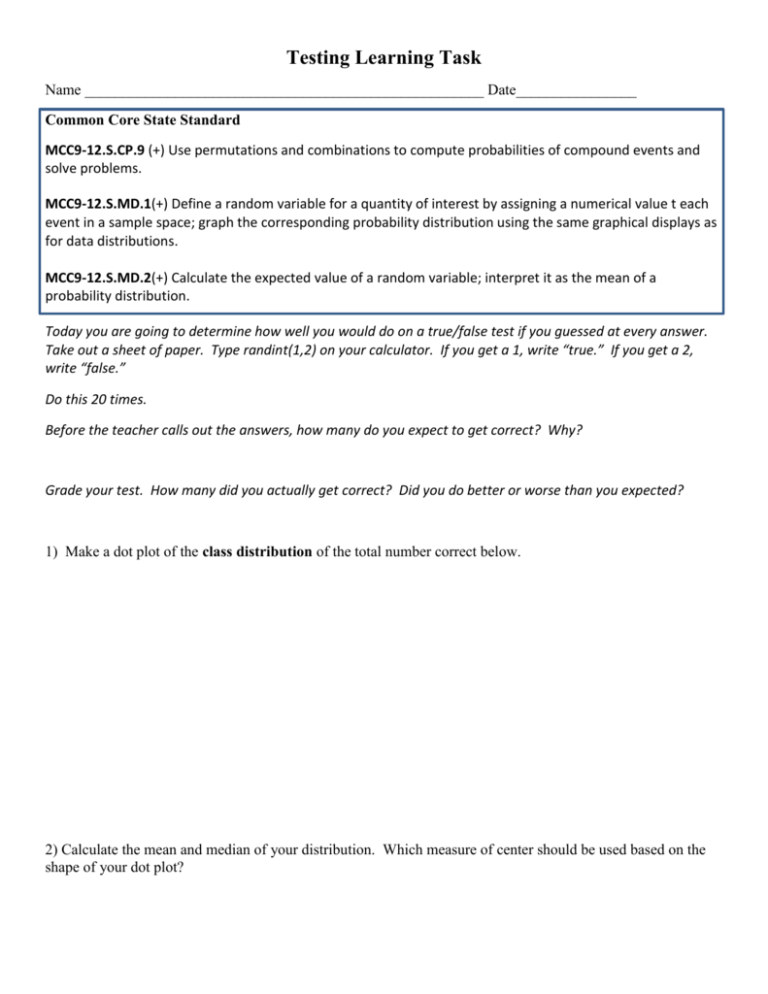
Testing Learning Task Name _____________________________________________________ Date________________ Common Core State Standard MCC9-12.S.CP.9 (+) Use permutations and combinations to compute probabilities of compound events and solve problems. MCC9-12.S.MD.1(+) Define a random variable for a quantity of interest by assigning a numerical value t each event in a sample space; graph the corresponding probability distribution using the same graphical displays as for data distributions. MCC9-12.S.MD.2(+) Calculate the expected value of a random variable; interpret it as the mean of a probability distribution. Today you are going to determine how well you would do on a true/false test if you guessed at every answer. Take out a sheet of paper. Type randint(1,2) on your calculator. If you get a 1, write “true.” If you get a 2, write “false.” Do this 20 times. Before the teacher calls out the answers, how many do you expect to get correct? Why? Grade your test. How many did you actually get correct? Did you do better or worse than you expected? 1) Make a dot plot of the class distribution of the total number correct below. 2) Calculate the mean and median of your distribution. Which measure of center should be used based on the shape of your dot plot? 3) Based on the class distribution, what percentage of students passed? 4) Calculate the probabilities based on the dot plot: a) What is the probability that a student got less than 5 correct? b) What is the probability that a student got exactly 10 correct? c) What is the probability that a student got between 9 and 11 correct (inclusive)? d) What is the probability that a student got 10 or more correct? e) What is the probability that a student got 15 or more correct? f) What is the probability that a student passed the test? g) Is it more likely to pass or fail a true/false test if you are randomly guessing? h) Is it unusual to pass a test if you are randomly guessing? For a situation to be considered as having a binomial distribution, the following conditions must be satisfied: Each observation/trial has one of two outcomes. These two outcomes are referred to as “success” or “failure”. There are a fixed number of observations/trials. The number of observations/trials is referred to as n. The observations/trials must be independent. The probability of success, referred to as p, is the same for each observation/trial. 5) Can this true-false test be considered a binomial setting? Why or why not? Binomial Probability When X has the binomial distribution with n observations and probability p of success on each observation, the possible values of X are 0, 1, 2, . . ., n. The probability of X successes in this setting is computed with the formula: n X n X P( X ) p 1 p r or n! X n X P( X ) p 1 p (n X )! X ! 6) Still considering that T-F test, calculate the following probabilities using the Binomial Distribution: a) What is the probability that a student got less than 5 correct? b) What is the probability that a student got exactly 10 correct? c) What is the probability that a student got between 9 and 11 correct (inclusive)? d) What is the probability that a student got 10 or more correct? e) What is the probability that a student got 15 or more correct? f) What is the probability that a student passed the test? g) Is it more likely to pass or fail a true/false test if you are randomly guessing? h) Is it unusual to pass a test if you are randomly guessing? *Compare these probabilities to those you calculated based on your class dot plot. Testing Learning Task (Part 2) Suppose there is a 5 question multiple choice test. Each question has 4 answers (A, B, C, or D). 1) Can this multiple choice test be considered a binomial setting? Why or why not? 2) If you are strictly guessing, calculate the following probabilities: 0 1 3 a) P(0 correct) = 5 C0 4 4 5 b) P(1 correct) = c) P(2 correct) = d) P(3 correct) = e) P(4 correct) = f) P(5 correct) = 3) Draw a histogram of the probability distribution for the number of correct answers below. Label the x-axis as the number of correct answers. The y-axis should be the probability of x. 4) Based on the distribution, how many problems do you expect to get correct? 5) Based on the distribution, how likely is it that you would pass if you were strictly guessing? (Calculate the probability of getting 4 or 5 correct.) 6) What is the probability that you will get less than 3 correct? 7) What is the probability that you will get at least 3 correct? Now let’s look at tests, such as the SAT, when you are penalized for guessing incorrectly. Suppose you have a multiple choice test with five answers (A, B, C, D, or E) per problem. The probability your guess is correct = 1/5 and the probability that your guess is incorrect = 4/5. Suppose the test that you are taking will award you one point for each question correct, but penalize you by ¼ of a point for each question you answer incorrectly. Test scores will be rounded to the nearest 10 percent. 8) If you strictly guess and get exactly 4 correct and 6 incorrect, what would be your score? 9) If you take a 10 question test and know that 8 questions are correct, should you guess the answers for the other two questions? 10) If you take a 10 question test and know that 6 questions are correct, should you guess the answers for the other 4 questions? 11) Given that you answered all 10 questions and you knew that 6 were correct, answer the following questions: a) If you can eliminate one of the answer choices for each of the 4 questions for which you are guessing, what would your expected score be? b) If you can eliminate two of the answer choices for each of the 4 questions for which you are guessing, what would your expected score be? c) If you can eliminate three of the answer choices for each of the 4 questions for which you are guessing, what would your expected score be?
