Family Resource Survey 2013
advertisement
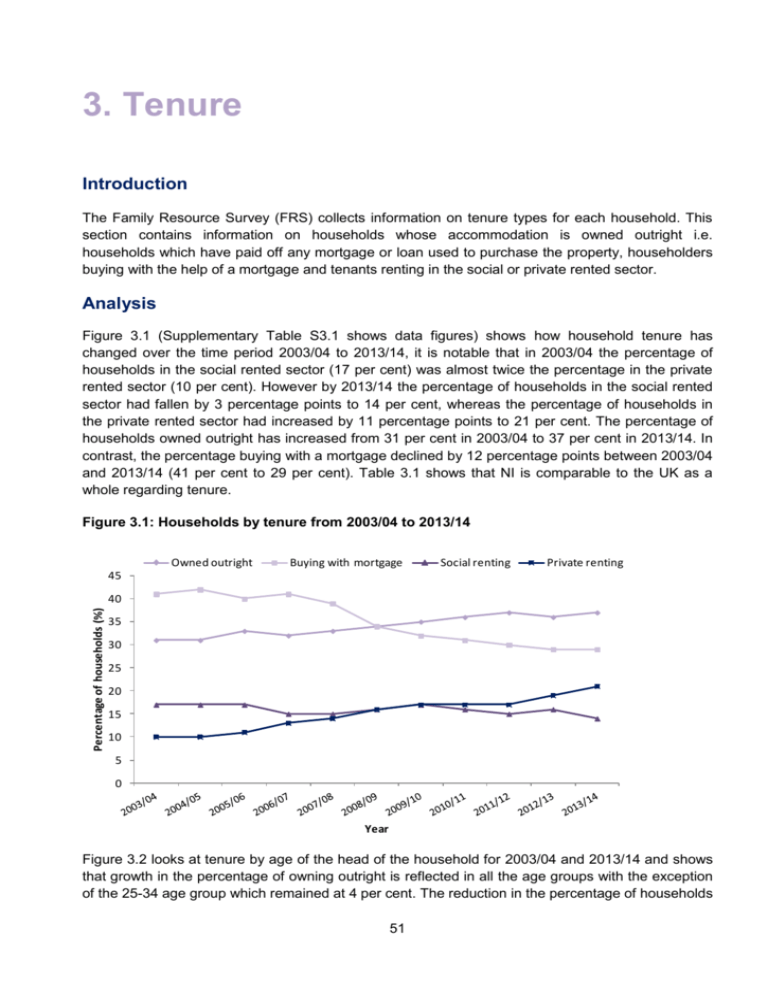
3. Tenure Introduction The Family Resource Survey (FRS) collects information on tenure types for each household. This section contains information on households whose accommodation is owned outright i.e. households which have paid off any mortgage or loan used to purchase the property, householders buying with the help of a mortgage and tenants renting in the social or private rented sector. Analysis Figure 3.1 (Supplementary Table S3.1 shows data figures) shows how household tenure has changed over the time period 2003/04 to 2013/14, it is notable that in 2003/04 the percentage of households in the social rented sector (17 per cent) was almost twice the percentage in the private rented sector (10 per cent). However by 2013/14 the percentage of households in the social rented sector had fallen by 3 percentage points to 14 per cent, whereas the percentage of households in the private rented sector had increased by 11 percentage points to 21 per cent. The percentage of households owned outright has increased from 31 per cent in 2003/04 to 37 per cent in 2013/14. In contrast, the percentage buying with a mortgage declined by 12 percentage points between 2003/04 and 2013/14 (41 per cent to 29 per cent). Table 3.1 shows that NI is comparable to the UK as a whole regarding tenure. Figure 3.1: Households by tenure from 2003/04 to 2013/14 Owned outright Buying with mortgage Social renting Private renting 45 Percentage of households (%) 40 35 30 25 20 15 10 5 0 Year Figure 3.2 looks at tenure by age of the head of the household for 2003/04 and 2013/14 and shows that growth in the percentage of owning outright is reflected in all the age groups with the exception of the 25-34 age group which remained at 4 per cent. The reduction in the percentage of households 51 buying with a mortgage is most pronounced in the younger age groups. Similarly the growth in the percentage renting privately is concentrated in the younger age groups. For example, the percentage of households headed by someone aged 25-34 years that are in the privately rented sector has increased from 16 per cent in 2003/04 to 47 per cent in 2013/14, an increase of 31 percentage points. Over the same period, the percentage buying with a mortgage in this category has decreased from 66 per cent to 35 per cent, a reduction of 31 percentage points. Figure 3.2: Housing tenure in NI by age of head of household in 2003/04 and 2013/14 Age of head Owned outright, % Buying with mortgage, % Social renting, % Private rented, % All 2003/04 16-24 . 27 29 44 100% 25-34 4 66 14 16 100% 35-44 12 64 17 7 100% 45-54 24 58 13 6 100% 55-64 53 24 16 7 100% 65+ 63 4 23 11 100% All 31 41 17 10 100% 2013/14 16-24 . 5 15 78 100% 25-34 4 35 14 47 100% 35-44 13 57 8 23 100% 45-54 33 43 12 13 100% 55-64 57 20 16 7 100% 65+ 73 2 18 7 100% All 37 29 14 21 100% Figure 3.3 (for data see Table S3.2) shows that the median weekly household rent is higher for private renters than for social renters. Social sector rent levels and increases are controlled through government-set formulae set out in the housing regulator’s rent standard and Government guidance. Differences may also, in part, reflect the difference in the type of properties in the sectors, with the private rented sector having a much wider and more varied range of stock. Comparing the regions of the United Kingdom, Northern Ireland (and Yorkshire and the Humber, the North East, East and West Midlands and Wales) had the joint lowest ratio between median weekly private sector rents and social sector rents (1.3) and the highest was observed in Inner-London (2.5). This compares to the overall United Kingdom figure of 1.5. Private rent is generally less expensive than mortgage instalments (repayment mortgages only) in all regions of the UK apart from London. Private rent is on average £12 less than mortgage instalments (repayment mortgages only) in Northern Ireland this compares to the UK average of £2 less. 52 Social Rent 300 Private Rent 250 Mortgage Instalment 200 150 100 50 United Kingdom Scotland Wales Northern Ireland Region England South West South East Outer London Inner London London East of England West Midlands East Midlands Yorkshire and the Humber North West 0 North East Median weekly rent/ mortgage instalment (£) Figure 3.3: Median weekly household rent/ mortgage instalment by region and tenure Table 3.8 compares tenure to state support received. 71 per cent of all owner households are in receipt of benefit compared to 97 per cent of social sector rented households and 66 per cent of privately rented households. In the social rented sector 78 per cent of households receive housing benefit whereas only 36 per cent of private renters receive housing benefit. Notes for Analysis 1. The social rented sector combines the categories “Rented from Northern Ireland Housing Executive (NIHE)” and “Rented from a Housing Association”. This is because some housing association tenants may wrongly report that they are NIHE tenants. For instance, where their home used to be owned by NIHE and although ownership has now transferred to a housing association, the tenant may still think their home belongs to the NIHE. 2. Household rent will also be influenced by the size of the property. This has not been taken into account in Figure 3.3. 3. Interest only mortgage payments are not included in Figure 3.3. This is because the interest only payment represents only part of the overall housing costs for these respondents and the cost of any capital repayment plan cannot reliably be separated from other savings and investments. 4. In Figure 3.3, rent paid as part of an affordable shared co-ownership part-rent, part-buy with a mortgage) is included as part of the mortgage payment. 5. Figures are rounded to the nearest percentage point and may not sum due to rounding. Alternative Data Sources Administrative sources: The Housing Association Performance Indicators: https://www.dsdni.gov.uk/publications/registered-housing-associations-performanceindicators-2013-2014 53 Survey sources: Northern Ireland House Condition Survey: http://www.nihe.gov.uk/index/sp_home/research-2/house_condition_survey.htm The Northern Ireland Housing Market, Review and Perspectives: http://www.nihe.gov.uk/index/corporate/housing_research/housing_market_review.htm Different data sources relating to housing, including the FRS, are used in compendia publications. One such report is: The annual Northern Ireland Housing Statistics https://www.dsdni.gov.uk/topics/dsd-statistics-and-research-housing/housing-statistics Detailed Tables Contents and points to note when interpreting tables The base used for all the tables in this section is households. Tables 3.1 to 3.4 provide information on tenure split by region, Local Government District (LGD), household composition and age of head. Table 3.2 has been created from the combined 2011/12, 2012/13 and 2013/14 FRS survey cases. This is due to small sample size at the Local Government District (LGD) level in individual years. In 2013/14 Northern Ireland had 26 LGDs but due to sample size, Cookstown & Magherafelt, Larne & Moyle and Omagh & Strabane have been paired resulting in 23 LGDs being represented. LGDs which have been combined have been selected to satisfy sample size requirements, and geographical location. Due to the combined three year dataset being used the sample size for households in Table 3.2 will differ from the sample size for households in the other tables in the section. Table 3.5 considers length of residency of head for different tenure types and therefore provides information on mobility of households. Table 3.6 provides information on weekly housing costs. Housing cost information is split by tenure. Housing costs in NI include: rent (gross of housing benefits), mortgage interest payments, structural insurance premiums (for owner occupiers), ground rent and service charges. In GB housing costs also include: water rates, community water charges and council water charges). Table 3.7 provides information on weekly rent for households; rent figures include any Housing Benefit in payment. Table 3.8 shows households by tenure and state support. 54 Key definitions used Pease refer to the Glossary for definitions of key terms used in this section. Changes to tables between 2012/13 and 2013/14 Prior to 6 April 2010, women reached State Pension age at 60. From 6 April 2010, the qualifying age for women has been gradually increasing. FRS data contained in this report was collected throughout the financial year 2013/14, during which the State Pension age for women increased from 61 years and 5 months to 62 years 0 months. The changes do not affect the state pension age for men, currently 65. This affects tables 3.3 and 3.5. 55 56 Table 3.1: Households by tenure and region/country Percentage of households Region/Country Tenure All ow ners North East Yorkshire North and the West Humber East Midlands West Midlands East of England London Inner London Outer London South East South West England Wales Scotland Northern Ireland United Kingdom 60 64 63 68 66 67 49 38 55 69 67 63 69 61 65 63 Owned outright 30 32 33 35 36 34 20 13 25 36 38 32 40 32 37 33 Buying with a mortgage 30 32 30 32 30 33 29 25 31 32 29 31 29 30 29 31 Social rented sector 25 19 19 15 19 16 22 30 18 13 11 17 16 23 14 18 Rented privately 15 17 18 17 15 17 29 33 27 19 21 19 15 16 21 19 744 1,968 1,484 1,294 1,519 1,674 1,749 601 1,148 2,422 1,448 14,302 875 3,000 1,965 20,142 Sample Size (=100%) 57 Table 3.2: Households by tenure and Local Government District Percentage of households Local Government District Tenure Ballymoney Banbridge Belfast Carrickfergus 66 .. 74 52 68 43 40 .. 39 27 38 25 26 .. 36 25 30 Antrim Ards 75 78 68 Owned outright 33 44 Buying with a mortgage 42 34 All ow ners Social rented sector Rented privately Sample Size (=100%) 1 Armagh Ballymena 7 14 14 13 .. 9 24 18 18 8 18 21 .. 16 24 13 150 272 235 195 88 163 923 128 Percentage of households Local Government District Castlereagh Coleraine Craigavon Dow n All ow ners Owned outright Buying with a mortgage 77 45 32 66 47 19 62 26 37 67 40 27 62 45 17 Social rented sector Rented privately 10 12 16 18 13 25 10 23 267 177 300 242 Tenure Sample Size (=100%) 1 Dungannon Fermanagh Limavady Lisburn 70 49 20 70 46 25 72 36 36 11 27 13 17 10 19 16 12 220 186 102 354 Percentage of households Local Government District Cookstow n New tow nNorth & abbey Dow n Magherafelt2 Derry New ry & Mourne All ow ners Owned outright Buying with a mortgage 58 26 32 71 42 30 69 36 33 74 38 36 69 41 27 65 37 28 68 37 31 66 37 29 Social rented sector Rented privately 25 17 9 19 14 17 11 16 8 23 14 21 14 18 15 19 329 266 268 256 229 168 281 5,799 Tenure Sample Size (=100%) 1 1 2011/12, 2012/13 & 2013/14 survey data have been combined to create this table 2 Two LGDs combined due to sample size requirements 58 Larne & Moyle2 Omagh & Northern Strabane2 Ireland Table 3.3: Households by tenure and composition Percentage of households All households w ithout children Tenure All households w ith children One female Three or adult, no Tw o adults, more adults, One male adult, no children children no children no children Ow ned Household composition Households Three or w ith one or One adult, Tw o adults, more adults, more adults w ith w ith w ith over pension children children children age 1 Households Households w ith one or w ith one or more more disabled unemployed adults under adults under All pension age 1,2 pension age 1 Households 47 56 74 .. 26 70 .. 76 53 43 65 Owned outright 34 45 53 .. 5 13 .. 71 31 14 37 Buying with a mortgage 13 12 20 .. 21 57 .. 5 23 30 29 Social rented sector 24 24 9 .. 28 8 .. 17 26 27 14 Rented privately 29 20 18 .. 47 22 .. 7 20 29 21 283 315 565 97 187 459 59 592 381 116 1,965 Sample Size (=100%) 1 From 6 April 2010, the State Pension age for women has been gradually increasing. FRS data contained in this report was collected throughout the financial year 2013/14, during which the State Pension age for women increased from 61 years and 5 months to 62 years 0 months. The changes do not affect the State Pension age for men, currently 65 2 The disability questions in the FRS were changed from the 2012/13 survey to comply with the harmonised standards published in August 2011. This means that neither the definition of disability nor the impairment types are comparable with those in earlier reports 59 Table 3.4: Households by tenure and age of head Percentage of households Age All 75+ Households Tenure 16-24 25-34 35-44 45-54 55-59 60-64 65-74 Ow ned .. 39 70 75 75 79 77 72 65 Owned outright .. 4 13 33 50 65 74 71 37 Buying with a mortgage .. 35 57 43 25 14 3 1 29 Social rented sector .. 14 8 12 18 15 18 19 14 Rented privately .. 47 23 13 7 6 5 9 21 68 303 366 394 177 145 294 218 1,965 Sample Size (=100%) 60 Table 3.5: Households by tenure, length of residency of head and age of head Percentage of households w here head is of w orking age Tenure Less than 12 months Ow ned Length of residency 12 months, 2 years, 3 years, 5 years, 10 years, less than 2 less than 3 less than 5 less than 10 less than 20 20 years, years years years years years or longer Sample Size (=100%) 2 3 4 7 22 31 31 875 Owned outright 1 1 1 4 11 24 58 344 Buying with a mortgage 3 4 5 9 29 36 13 531 9 12 6 11 21 24 18 198 Rented privately 33 20 13 12 16 4 3 353 All households 11 9 6 9 20 23 22 1,426 Social rented sector Percentage of households w here head is of pension age Length of residency Tenure Less than 12 months Ow ned 12 months but 2 years but 3 years but 5 years but 10 years but less than 2 less than 3 less than 5 less than 10 less than 20 years years years years years 20 years or longer Sample Size (=100%) - - 1 1 9 15 73 397 Owned outright - - 1 1 8 14 74 383 Buying with a mortgage .. .. .. .. .. .. .. 14 Social rented sector 2 3 1 7 11 28 48 101 Rented privately .. .. .. .. .. .. .. 41 All households 1 1 1 3 10 18 66 539 Percentage of households Length of residency 12 months but 2 years but 3 years but 5 years but 10 years but less than 2 less than 3 less than 5 less than 10 less than 20 years years years years years 20 years or longer Sample Size (=100%) Tenure Less than 12 months Ow ned 2 2 3 5 18 26 43 1,272 Owned outright 1 1 1 3 9 19 66 727 Buying with a mortgage 3 4 5 8 29 36 14 545 7 9 4 10 18 25 28 299 Rented privately 31 19 12 11 16 6 6 394 All households 8 7 5 7 18 22 33 1,965 Social rented sector 61 Table 3.6: Households by tenure and weekly housing costs Percentage of households Tenure Housing costs Less than £20 but £40 but £60 but £80 but £100 but £20 a under £40 a under £60 a under £80 a under £100 under £150 w eek w eek w eek w eek a w eek a w eek £150 a w eek or more Sample Size (=100%) 64 11 11 6 4 3 1 1,272 Owned outright 98 1 1 0 0 0 0 727 Buying with a mortgage 20 24 24 14 9 6 3 545 2 1 20 50 21 6 - 299 Rented privately 10 3 4 13 31 35 3 394 All Households 44 8 11 14 12 10 2 1,965 Ow ned Social rented sector 62 Table 3.7: Households in rented accommodation by region/country and weekly rent Percentage of households in the social rented sector £20 a w eek or less Over £20 but under £40 a w eek Over £40 but under £60 a w eek Weekly Rent Over £60 but under £80 a w eek North East 2 1 9 43 39 5 1 175 North West 1 1 5 41 43 10 - 382 Yorkshire and the Humber 3 2 10 48 30 7 - 293 East Midlands 2 2 4 46 39 6 0 208 West Midlands 1 - 4 30 51 14 1 306 East of England 0 1 4 18 41 35 2 284 London 1 2 2 5 23 55 12 439 South East - 2 2 12 32 44 9 327 South West - 1 2 27 40 27 2 178 England 1 1 4 27 36 26 4 2,592 Wales 2 2 6 47 39 3 1 145 Scotland 1 2 29 48 14 4 1 714 Northern Ireland 2 1 21 50 21 6 - 299 All 1 2 8 31 34 22 3 3,750 Region/country Over £80 but under £100 a w eek Over £100 but under £150 a w eek £150 a w eek or more Sample Size (=100%) UK Region 63 Table 3.7: Households in rented accommodation by region/country and weekly rent (continued) Percentage of households in the private rented sector £20 a w eek or less Over £20 but under £40 a w eek Over £40 but under £60 a w eek Weekly Rent Over £60 but under £80 a w eek North East .. .. .. .. .. .. .. 91 North West 8 0 2 4 18 56 12 300 Yorkshire and the Humber 6 1 2 11 20 49 12 223 East Midlands 7 0 4 8 24 45 12 195 West Midlands 5 - 1 10 15 59 10 190 East of England 5 2 1 3 7 41 41 261 London 5 0 1 5 2 8 79 408 South East 7 1 1 4 6 25 56 374 South West 7 1 1 2 10 44 35 243 England 6 1 2 5 11 36 39 2,285 Wales 8 0 4 12 24 41 10 127 Scotland 15 1 3 7 18 38 18 418 Northern Ireland 10 3 4 13 32 35 3 394 7 1 2 6 13 36 35 3,224 Region/country Over £80 but under £100 a w eek Over £100 but under £150 a w eek £150 a w eek or more Sample Size (=100%) UK Region All 64 Table 3.7: Households in rented accommodation by region/country and weekly rent (continued) Percentage of households Weekly Rent £20 a w eek or less Over £20 but under £40 a w eek Over £40 but under £60 a w eek Over £60 but under £80 a w eek Over £80 but under £100 a w eek Over £100 but under £150 a w eek £150 a w eek or more Sample Size (=100%) North East 3 2 7 28 32 24 4 266 North West 4 1 4 23 31 31 6 682 Yorkshire and the Humber 4 2 6 30 25 27 6 516 East Midlands 5 1 4 26 31 27 7 403 West Midlands 3 - 2 21 35 34 5 496 East of England 3 1 3 10 24 38 21 545 London 3 1 2 5 11 28 50 847 South East 4 1 1 7 17 33 37 701 South West 4 1 1 11 20 38 24 421 England 4 1 3 16 23 31 22 4,877 Wales 5 1 5 31 32 21 5 272 Scotland 7 2 18 31 16 19 8 1,132 Northern Ireland 7 3 11 28 28 23 2 693 All 4 1 5 18 23 29 20 6,974 Region/country UK Region 65 Table 3.8: Households by tenure and state support receipt Percentage of households Tenure State support received Working Tax Credit All ow ners Owned Buying with outright a mortgage Social rented sector Rented privately All Households 5 2 10 8 13 7 Child Tax Credit 10 3 20 26 25 15 Income Support 1 1 1 23 12 6 Pension Credit 5 8 1 16 5 6 Housing Benefit 0 0 0 78 36 18 33 55 4 35 10 28 Widow 's Benefits - 1 0 - - - Jobseeker's Allow ance 3 2 4 18 11 7 Employment and Support Allow ance 3 4 3 10 6 5 Incapacity Benefit 2 2 1 6 1 2 Retirement Pension Severe Disability Allow ance - - 0 1 - - Attendance Allow ance 3 5 0 5 2 3 Carer's Allow ance Disability Living Allow ance (care component) Disability Living Allow ance (mobility component) 3 3 3 8 4 4 10 11 8 31 8 12 11 14 7 30 7 13 Industrial Injuries Disablement Benefit 1 1 - 1 0 - Armed Forces Compensation Scheme - - - 1 0 - Child Benefit 29 11 52 29 40 31 On any income related benefit 13 17 8 81 42 29 On any non-income related benefit 70 76 61 85 57 69 All in receipt of benefit 71 77 63 97 66 74 All in receipt of Tax Credits 11 4 21 27 26 17 All not in receipt of state support 28 22 36 3 33 26 1,272 727 545 299 394 1,965 Sample Size (=100%) 66 Section 3 Supplementary tables S3.1- Data for Figure 3.1: Households by tenure 2003/04 to 2013/14 S3.2- Data for Figure 3.3: Median weekly household rent and mortgage instalments by region/ country and tenure 67 Table S3.1: Households by tenure 2003/04 to 2013/14 Percentage of households Year Tenure 2003/04 2004/05 2005/06 2006/07 2007/08 2008/09 2009/10 2010/11 2011/12 2012/13 2013/14 Ow ned outright 31 31 33 32 33 34 35 36 37 36 37 Buying w ith mortgage 41 42 40 41 39 34 32 31 30 29 29 Social renting 17 17 17 15 15 16 17 16 15 16 14 Private renting 10 10 11 13 14 16 17 17 17 19 21 Sample size (=100%) 1,917 1,927 1,895 1,918 1,861 1,929 2,041 1,896 1,943 1,891 1,965 Table S3.2: Median weekly household rent and mortgage instalments by region/ country and tenure Median w eekly household rent/mortgage instalment1, £ Region/ Country Yorkshire and the East West East of Humber Midlands Midlands England North East North West Social rent 78 81 75 79 86 96 110 Private rent 104 113 108 106 115 138 Mortgage instalment 104 114 104 118 121 153 Tenure Sample size (=100%) 1 493 1,306 939 774 925 1,069 Inner London London Outer London South East South West England 114 108 101 89 87 77 230 284 213 158 137 133 196 195 203 172 143 138 1,345 Repayment mortgages only 68 511 834 1,448 822 9,121 Northern Ireland United Kingdom 65 69 84 100 108 92 127 108 113 104 129 Wales Scotland 523 1,964 1,231 12,839


