Standard Deviation and Boxplots Page Open the Excel file StdDev
advertisement

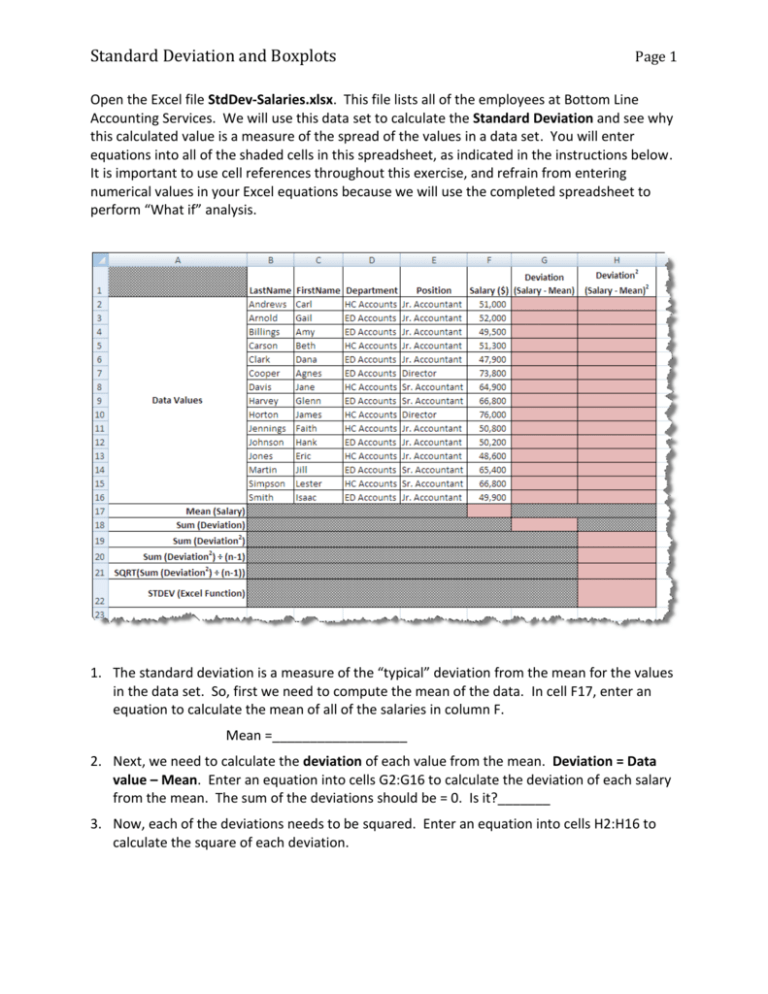
Standard Deviation and Boxplots Page 1 Open the Excel file StdDev-Salaries.xlsx. This file lists all of the employees at Bottom Line Accounting Services. We will use this data set to calculate the Standard Deviation and see why this calculated value is a measure of the spread of the values in a data set. You will enter equations into all of the shaded cells in this spreadsheet, as indicated in the instructions below. It is important to use cell references throughout this exercise, and refrain from entering numerical values in your Excel equations because we will use the completed spreadsheet to perform “What if” analysis. 1. The standard deviation is a measure of the “typical” deviation from the mean for the values in the data set. So, first we need to compute the mean of the data. In cell F17, enter an equation to calculate the mean of all of the salaries in column F. Mean =__________________ 2. Next, we need to calculate the deviation of each value from the mean. Deviation = Data value – Mean. Enter an equation into cells G2:G16 to calculate the deviation of each salary from the mean. The sum of the deviations should be = 0. Is it?_______ 3. Now, each of the deviations needs to be squared. Enter an equation into cells H2:H16 to calculate the square of each deviation. Standard Deviation and Boxplots Page 2 4. Next, the sum the squares of the deviations needs to be determined. Enter an equation into cell H19 that calculates the sum of the squares of the deviations. Sum of (Deviation)2 = ______________ 5. Now, the sum of the squares of the deviations needs to be divided by (n-1), where n is the number of data points. Enter an equation into cell H20 that calculates the sum of the deviations squared divided by (n-1), where n is the number of data points. 𝑆𝑢𝑚 𝑜𝑓 (𝐷𝑒𝑣𝑖𝑎𝑡𝑖𝑜𝑛)2 𝑛−1 = ___________________ 6. Lastly, we need to determine the non-negative square root of the result above to get the standard deviation. In cell H21, enter an equation to calculate the square root of the result obtained in step 5. This is the square root of the salaries. Standard Deviation = √ ∑(𝐷𝑎𝑡𝑎 𝑣𝑎𝑙𝑢𝑒−𝑀𝑒𝑎𝑛)2 𝑛−1 = ____________________ 7. Now, in cell H21, use the built-in STDEV function in Excel to calculate the standard deviation of the salaries. STDEV = ______________ 8. Use the spreadsheet to perform “what if’ analysis. What happens if the salaries of each of the directors is increased by $100,000. In cells F7 and F10, increase the salary by $100,000. Observe what happens to the calculations you previously entered. 9. Standard Deviation of 2nd data set = __________________________ 10. Compare the standard deviations from the two data sets. What can you say about the affect of outliers on the standard deviation? 11. Sketch the boxplots of the two data sets on the same scale. 12. Compare the standard deviations with the boxplots for each of the data sets. What can you say about the relationship between the standard deviation and the sketch of the boxplots?


