Supplementary Appendix - Springer Static Content Server
advertisement
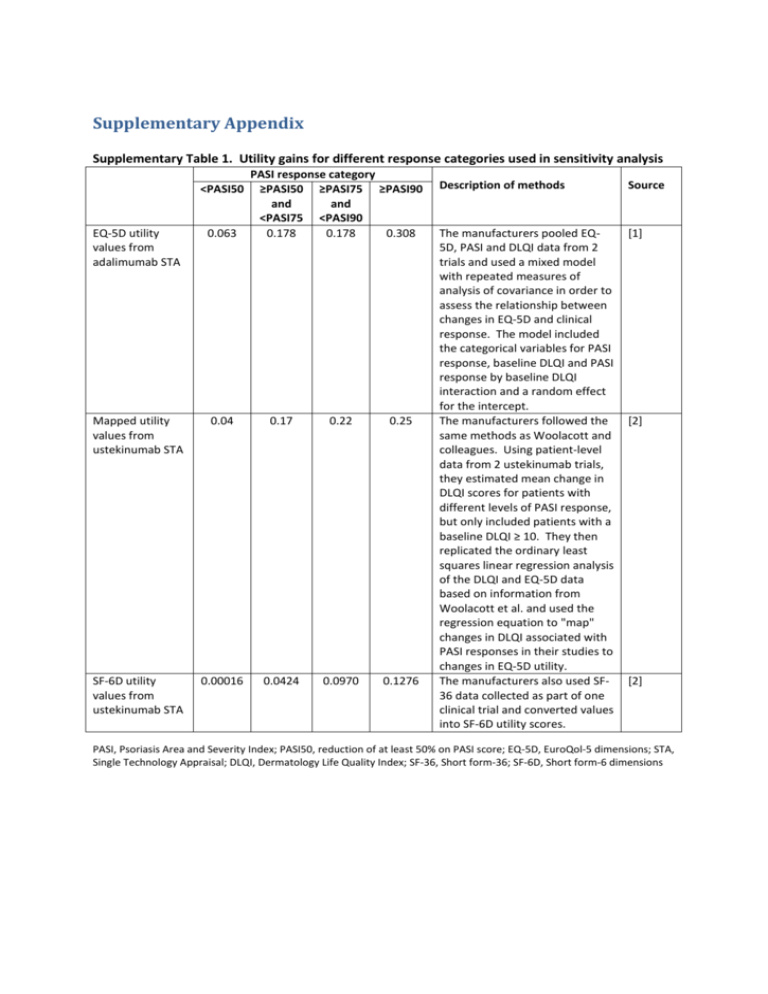
Supplementary Appendix Supplementary Table 1. Utility gains for different response categories used in sensitivity analysis <PASI50 PASI response category ≥PASI50 ≥PASI75 ≥PASI90 and and <PASI75 <PASI90 0.178 0.178 0.308 EQ-5D utility values from adalimumab STA 0.063 Mapped utility values from ustekinumab STA 0.04 0.17 0.22 0.25 SF-6D utility values from ustekinumab STA 0.00016 0.0424 0.0970 0.1276 Description of methods Source The manufacturers pooled EQ5D, PASI and DLQI data from 2 trials and used a mixed model with repeated measures of analysis of covariance in order to assess the relationship between changes in EQ-5D and clinical response. The model included the categorical variables for PASI response, baseline DLQI and PASI response by baseline DLQI interaction and a random effect for the intercept. The manufacturers followed the same methods as Woolacott and colleagues. Using patient-level data from 2 ustekinumab trials, they estimated mean change in DLQI scores for patients with different levels of PASI response, but only included patients with a baseline DLQI ≥ 10. They then replicated the ordinary least squares linear regression analysis of the DLQI and EQ-5D data based on information from Woolacott et al. and used the regression equation to "map" changes in DLQI associated with PASI responses in their studies to changes in EQ-5D utility. The manufacturers also used SF36 data collected as part of one clinical trial and converted values into SF-6D utility scores. [1] [2] [2] PASI, Psoriasis Area and Severity Index; PASI50, reduction of at least 50% on PASI score; EQ-5D, EuroQol-5 dimensions; STA, Single Technology Appraisal; DLQI, Dermatology Life Quality Index; SF-36, Short form-36; SF-6D, Short form-6 dimensions Supplementary Table 2. Quantity of monitoring tests and outpatient visits per patient - 13.5-week trial period FBC (£2.83) (a) LFT (£0.71) (a) U&E (£1.31)(a) Outpatient visits (£82)(b) Adalimumab 2 2 2 2 Etanercept 2 2 2 2 Infliximab 3 3 3 1 (a) Ustekinumab 2 2 2 2 Biologic (a) Unit costs for monitoring tests from Woolacott and colleauges[3] and inflated to 2013-14 prices using the Hospital and Community Health Services inflation index[4] (b) NHS Reference Costs[5] inflated to 2013-14 value (c) Patients are reviewed during infusion visits and then one additional outpatient appointment. FBC, Full blood count; LFT, liver function test; U&E, Urea and Electrolytes, including serum creatinine Supplementary Table 3. Annual monitoring tests and outpatient visits per patient - treatment period FBC (£3.01) LFT (£0.76) U&E (£1.39) PIIINP (£26.93) Methotrexate 4 4 4 4 Ciclosporin 4 4 4 Adalimumab 4 4 4 4 Etanercept 4 4 4 4 Infliximab 4 4 4 4 Ustekinumab 4 4 4 4 Biologic GFR (£251) 1 Liver biopsy (£596) Outpatient visit (£88) 0.04 (a) 4 4 (a) Frequency of liver biopsy with methotrexate with concurrent use of PIIINP test was based on estimates from Chalmers and colleagues[6] (b) GFR, Glomerular Filtration Rate Costs for glomerular filtration rate (GFR) testing and liver biopsy were taken from NHS reference costs[5] and inflated to 2013-14 values. Liver biopsy was assumed to be performed as a day case procedure (code GB04Z) and GFR testing was based on a weighted average of the test performed as a diagnostic imaging outpatient procedure, direct access procedure or other (code RA37Z). The number of outpatient visits during the trial period for each biologic agent is also presented. Supplementary Table 4. Distribution parameters for model inputs Variable Description (HRG code, if applicable) Mean utility gain associated with PASI00 0.05 Distribution type Gamma utility gain associated with PASI50 compared to PASI00 0.12 utility gain associated with PASI75 compared to PASI50 alpha beta Source 25 0.002 [3] Gamma 8.47058824 0.0141667 [3] 0.02 Gamma 0.125 0.16 [3] utility gain associated with PASI90 compared to PASI75 0.02 Gamma 0.09756098 0.205 [3] utility gain associated with PASI00 0.12 Gamma 16 0.0075 [3] utility gain associated with PASI50 compared to PASI00 0.17 Gamma 6.42222222 0.0264706 [3] utility gain associated with PASI75 compared to PASI50 0.09 Gamma 0.81 0.1111111 [3] utility gain associated with PASI90 compared to PASI75 0.03 Gamma 0.06206897 0.4833333 [3] cost of consultant led OP follow-up visit 86.01 Gamma 1772.669 0.0485178 [5] cost of non-consultant led OP follow-up visit 63.64 Gamma 480.438 0.1324679 [5] cost of regular day/night admission (JD02C) 315.85 Gamma 410.295 0.7698229 [5] cost of phototherapy session as OP procedure (JC29Z) cost of phototherapy session as regular day/night admission (JC29Z) cost of complex topicals as day case (JD02A) 81.71 Gamma 227.144 0.3597122 [5] 151.24 Gamma 10.133 14.925373 [5] 388.69 Gamma 4185.436 0.0928678 [5] cost of complex topicals as day case (JD02B) 386.18 Gamma 3682.566 0.1048658 [5] cost of complex topicals as day case (JD02C) 351.09 Gamma 459.231 0.764526 [5] cost of elective IP with major CC (JD02A) 4403.77 Gamma 226.354 19.455253 [5] cost of elective IP with intermediate CC (JD02B) 3720.19 Gamma 134.671 27.624309 [5] cost of elective IP without CC (JD02C) 3348.11 Gamma 198.9113 16.832183 [5] cost of excess bed day elective IP stay, major CC (JD02A) 184.56 Gamma 27.131 6.8027211 [5] cost of excess bed day elective IP stay, intermediate CC (JD02B) 226.82 Gamma 514.659 0.4407228 [5] cost of excess bed day elective IP, without CC (JD02C) 302.59 Gamma 1868.792 0.1619171 [5] cost of non-elective IP stay, with major CC (JD02A) 3873.07 Gamma 210.5789 18.392496 [5] cost non-elective IP stay, with intermediate CC (JD02B) 3332.04 Gamma 160.6375 20.742585 [5] cost non-elective IP stay, without CC (JD02C) 3378.98 Gamma 89.8471 37.608123 [5] 197.54 Gamma 6633.504 0.0297787 [5] 185.53 Gamma 26.345 7.0422535 [5] 247.74 Gamma 14.9388 16.583748 [5] 245.61 Gamma 419.995 0.5847953 [5] cost of GFR other (RA37Z) 301.90 Gamma 1863.938 0.1619695 [5] cost of GFR direct access (RA37Z) 71.45 Gamma 19.364 3.6900369 [5] cost of liver biopsy (GB04Z) 553.31 Gamma 1009.794 0.5479452 [5] cost of excess bed day non-elective IP stay, with major CC (JD02A) cost of excess bed day non-elective IP stay , with intermediate CC (JD02B) cost excess bed day non-elective IP stay, without CC (JD02C) cost of OP GFR (RA37Z) HRG, health related group; PASI, Psoriasis Area and Severity Index; PASI50, reduction of at least 50% on PASI score; OP, outpatient; CC, co-morbidity and complication; IP, inpatient; GFR, glomerular filtration rate Supplementary Table 5. Description of sensitivity and scenario analyses Sensitivity and scenario analyses Structural assumptions Time horizon = 1 year Time horizon = 2 years Time horizon = 5 years Stopping rule: Continue to 'treatment' period if PASI50 Duration of 'trial' period adjusted for each drug Gradual loss of efficacy (40% drop 1 PASI category per year) Biologic inputs Infliximab & Ustekinumab only Infliximab only Ustekinumab only Weighted average biologic (BADBIR data)* 10% annual dropout 50% annual dropout 70% annual dropout 64% reduction in hospitalisations on biologic therapy 100% reduction in hospitalisations on biologic therapy Best supportive care inputs BSC pPASI50 = 65% BSC pPASI50 = 83% Description These sensitivity analyses focused on testing structural assumptions in the model The time horizon was limited to the 13.5-week trial period followed by 1 year The time horizon was limited to the 13.5-week trial period followed by 2 years The time horizon was limited to the 13.5-week trial period followed by 5 years In the base case, only patients with a PASI75 were considered responders and allowed to continue on treatment during the 'treatment' period. In this sensitivity analysis PASI50 is used as the threshold for treatment continuation. In the base case, the trial duration is 13.5 weeks for all drugs regardless of national guidance. In this sensitivity analysis, the trial period is adjusted for each drug (i.e. trial period is 12 weeks for etanercept, 16 weeks for ustekinumab and adalimumab and 10 weeks for infliximab) In the base case, level of treatment response achieved in the trial period was assumed to be maintained for the duration of the treatment period or until the patient dropped out. In this sensitivity analysis, it was assumed that loss of efficacy and drop out was more gradual. Before dropping out and switching to BSC, patients cycled first through lower levels of PASI response (i.e. PASI90 moved to PASI75, PASI75 to PASI50 and PASI50 to discontinuation). The rate tested was 40% per year would drop one PASI response category. These sensitivity analyses focused on testing inputs that specifically related to biologic, including their cost, persistence rates and effect on resource utilisation. In the base case, an average cost was assumed across all biologics. In this sensitivity analysis, an average of only infliximab and ustekinumab was used, reflecting the fact that the clinical trial data in the model was based only on these two drugs. In this sensitivity analysis, only infliximab cost data was used In this sensitivity analysis, only ustekinumab cost data was used, reflecting the fact that the majority of clinical trial data in the model was from trials of ustekinumab. In this sensitivity analysis, a weighted average of drugs was used, with weights informed by a distribution obtained from the British Association of Dermatologists Biologic Interventions Register (BADBIR) (cut-off 31st March 2012): Adalimumab= 1225, Etanercept = 665, Infliximab =143, Ustekinumab= 451 (Personal communication Dr Nicola Lawes 18th April 2012). In the base case, 20% of patients on biologic were assumed to drop out each year. In this sensitivity analysis, the drop-out rate was decreased to 10% per year. In this sensitivity analysis, the drop-out rate was increased to 50% per year. In this sensitivity analysis, the drop-out rate was increased to 70% per year. In the base case, biologic therapy was assumed to reduce hospitalisations by 76%. In this sensitivity analysis, biologic therapy was assumed to reduce hospitalisations by just 64% (data from Driessen and colleagues[7]. In this sensitivity analysis, biologic therapy was assumed to eliminate hospitalisations. These sensitivity analyses focused on testing inputs that specifically related to best supportive care, particularly its efficacy and cost. In the base case, the efficacy of best supportive care was based on effects observed in the placebo arms of included RCTs. In this sensitivity analysis, efficacy of best supportive care was based on the proportion of patients with a baseline PASI score of 10-20 who achieved a PASI50 following an inpatient hospitalisation of approximately 20.8 days[8] In this sensitivity analysis, efficacy of best supportive care was based on the MTX and Ciclosporin excluded from BSC BSC assumed as 1 annual hospitalisation and 5 outpatient visits Hospitalisations and other resource use inputs Longer mean LOS (23.7 days) if hospitalised Greater proportion very high need patients (30%) Lower very high need patients (5%) Fewer annual hospitalisations for high need patients (0.25) Fewer annual hospitalisations for high and very high need patients (0.5 and 2 respectively) 1 annual hospitalisation all patients 0.312 annual hospitalisations for all 0 annual hospitalisations BSC assumed as 1 annual hospitalisation and 5 outpatient visits; Biologics reduce number of hospitalisations 100% Utility inputs No utility gain for <PASI50 Utility gain values from patients with worst DLQI at baseline (4th quartile) Utility values from adalimumab STA Utility values from ustekinumab STA Utility values from ustekinumab STA using SF-6D BSC assumed as 1 annual proportion of patients with a baseline PASI score of >20 who achieved a PASI50 following an inpatient hospitalisation of approximately 23.7 days[8]. In the base case, MTX and ciclosporin are included among the best supportive care components. In this sensitivity analysis they are excluded. In the base case, best supportive care includes drug, monitoring, outpatient visits, phototherapy and day centre costs along with 1.28 hospitalisations per patient for a total cost of £11,435 per year. In this sensitivity analysis, only 1 hospitalisation and 5 outpatient visits are included per patient, costing just £6,512 per year. These sensitivity analyses focused on testing inputs that specifically related hospitalisation assumptions. In the base case, the mean length of stay (LOS) per hospital admission was 20.8 days based on the mean LOS for patients with PASI 10-20 at baseline in Woods and colleagues[8]. In this sensitivity analysis, this value was increased to 23.7 days, based on the LOS data for patients with PASI >20 at baseline. In the base case, 18% of patients were assumed to be very high need[7]. In this sensitivity analysis, the proportion of very high need patients was increased to 30%. In this sensitivity analysis, the proportion of very high need patients was decreased to 5%. In the base case, high need patients were assumed to require 1 hospitalisation each year. In this sensitivity analysis, only 25% of patients were assumed to require hospitalisation each year. In the base case, high need patients were assumed to require 1 hospitalisation and very high need, 2.55, each year. In this sensitivity analysis, only 50% of high need patients were assumed to require a hospitalisation each year and very high need patients were assumed to only require 2 per year. In this sensitivity analysis, high and very high need patients were assumed to require only 1 hospitalisation each year. In this sensitivity analysis, only 31.2% of patients were assumed to require a hospitalisation each year. In this sensitivity analysis, no one required a hospitalisation In this sensitivity analysis, patients on best supportive care are assumed to require only 5 outpatient visits and 1 hospitalisation per year, whilst patients on biologic therapy are assumed to require no hospitalisations. This scenario most closely matches the base case assumptions in economic evaluations of biologics for biologic-naive patients[3;9] . These sensitivity analyses focused on testing inputs that specifically related to utility data. The base case assumed that treatment non-responders (patients achieving <PASI50) gained 0.05 QALYs. In this sensitivity analysis, these patients are assumed to experience no benefits. In this sensitivity analysis, estimates of utility gain are sourced from an analysis undertaken in patients with the worst quality of life at baseline. The base case used utility data from Woolacott and colleagues[3] which was derived using data from etanercept trials. In this sensitivity analysis, EQ-5D data from the manufacturer's submission on the NICE STA for adalimumab was used. For details of the methods used, see Supplementary Table 1. In this sensitivity analysis, mapped EQ-5D data from the manufacturer's submission on the NICE STA for ustekinumab was used. For details of the methods used, see Supplementary Table 1. In this sensitivity analysis, mapped SF-6D data from the manufacturer's submission on the NICE STA for ustekinumab was used. For details of the methods used, see Supplementary Table 1. In this sensitivity analysis, other scenarios are combined to assess the impact hospitalisation and 5 outpatient visits and utility values from patients with worst DLQI at baseline of reduced resource use for BSC and worse baseline quality of life. PASI, Psoriasis Area and Severity Index; PASI50, reduction of at least 50% on PASI score; BSC, best supportive care; RCT, randomised controlled trial; MTX, methotrexate; LOS, length of stay; QALY, quality-adjusted life years; DLQI, Dermatology Quality Life Index; EQ-5D, EuroQol-5 dimensions; STA, single technology appraisal; NICE, National Institute for Health and Care Excellence; SF-6D, Short form-6 dimensions. References 1. National Institute for Health and Clinical Excellence. Adalimumab (Humira) for the treatment of moderate to severe plaque psoriasis Single Technology Appraisal Manufacturer's Submission. http://www nice org uk/guidance/ta146/documents/psoriasis-adalimumabappraisal-consultation-manufacturer-submission-abbott-laboratories-ltd2 [ 2007 Available from: URL:http://www.nice.org.uk/guidance/ta146/documents/psoriasis-adalimumabappraisal-consultation-manufacturer-submission-abbott-laboratories-ltd2 2. National Institute for Health and Clinical Excellence. Ustekinumab (Stelara) for the treatment of moderate to severe plaque psoriasis in England and Wales - Single Technology Appraisal Manufacturer Submission. http://www nice org uk/guidance/ta180/documents/psoriasisustekinumab-manufacturer-submission-janssencilag2 [ 2009 Available from: URL:http://www.nice.org.uk/guidance/ta180/documents/psoriasis-ustekinumabmanufacturer-submission-janssencilag2 3. Woolacott N, Hawkins N, Mason A, Kainth A, Khadjesari Z, Vergel YB et al. Etanercept and efalizumab for the treatment of psoriasis: a systematic review. Health Technol Assess 2006; 10(46):1-252. 4. Curtis L. Unit costs of social health care. Canterbury: Personal Social Services Reseach Unit, University of Kent; 2010. 5. Department of Health. NHS reference costs 2009-2010. http://www dh gov uk/en/Publicationsandstatistics/Publications/PublicationsPolicyAndGuidance/DH_123459 [ 2011 [cited 2011 Aug. 1]; Available from: URL:http://www.dh.gov.uk/en/Publicationsandstatistics/Publications/PublicationsPolicyAnd Guidance/DH_123459 6. Chalmers R, Kirby B, Smith A, Burrows P, Little R, Horan M et al. Replacement of routine liver biopsy by procollagen III aminopeptide for monitoring patients with psoriasis receiving longterm methotrexate: a multicentre audit and health economic analysis. Br J Dermatol 2005; 152(3):444-450. 7. Driessen RJ, Bisschops LA, Adang EM, Evers AW, van de Kerkhof PC, de Jong EM. The economic impact of high-need psoriasis in daily clinical practice before and after the introduction of biologics. Br J Dermatol 2010; 162(6):1324-1329. 8. Woods AL, Rutter KJ, Gardner LS, Lewis VJ, Saxena S, George SA et al. Inpatient management of psoriasis: a multicentre service review to establish national admission standards. Br J Dermatol 2008; 158(2):266-272. 9. Sizto S, Bansback N, Feldman SR, Willian MK, Anis AH. Economic evaluation of systemic therapies for moderate to severe psoriasis. Br J Dermatol 2009; 160(6):1264-1272.
