Electronic Supplementary Material 1: Taxonomic niche phylogenetic
advertisement
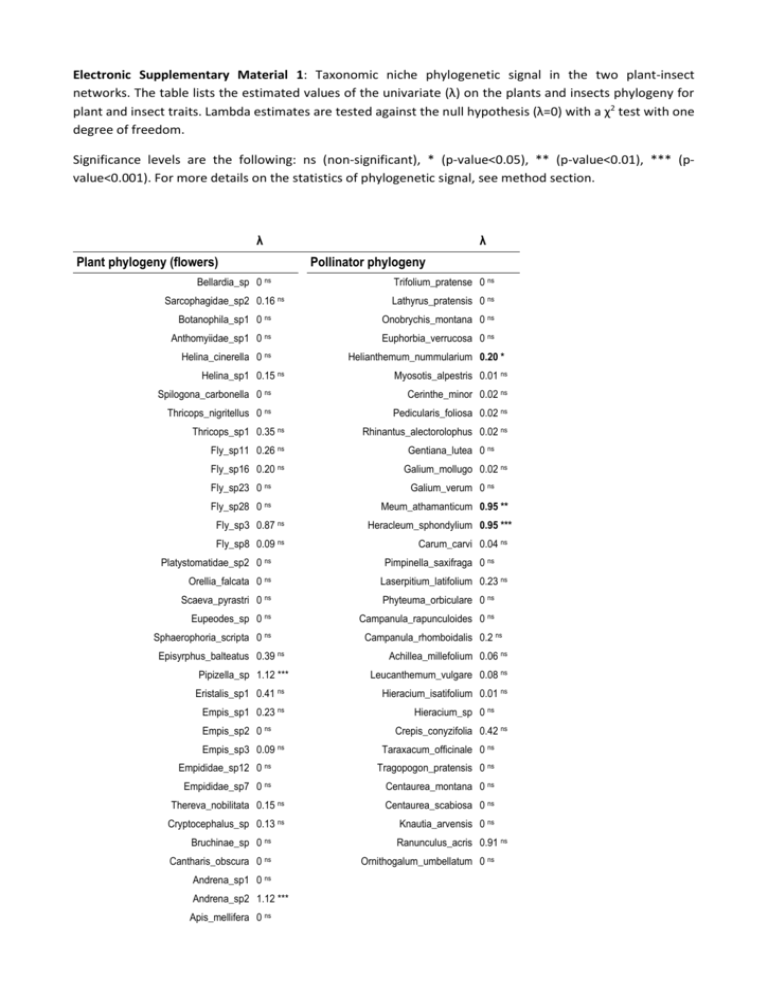
Electronic Supplementary Material 1: Taxonomic niche phylogenetic signal in the two plant-insect networks. The table lists the estimated values of the univariate (λ) on the plants and insects phylogeny for plant and insect traits. Lambda estimates are tested against the null hypothesis (λ=0) with a χ2 test with one degree of freedom. Significance levels are the following: ns (non-significant), * (p-value<0.05), ** (p-value<0.01), *** (pvalue<0.001). For more details on the statistics of phylogenetic signal, see method section. λ λ Plant phylogeny (flowers) Bellardia_sp 0 Pollinator phylogeny Trifolium_pratense 0 ns ns Sarcophagidae_sp2 0.16 ns Lathyrus_pratensis 0 ns Botanophila_sp1 0 ns Onobrychis_montana 0 ns Anthomyiidae_sp1 0 ns Euphorbia_verrucosa 0 ns Helina_cinerella 0 ns Helina_sp1 0.15 Helianthemum_nummularium 0.20 * ns Myosotis_alpestris 0.01 ns Spilogona_carbonella 0 ns Cerinthe_minor 0.02 ns Thricops_nigritellus 0 ns Pedicularis_foliosa 0.02 ns Thricops_sp1 0.35 ns Fly_sp11 0.26 ns Fly_sp16 0.20 ns Fly_sp23 0 ns Gentiana_lutea 0 ns Galium_mollugo 0.02 ns Galium_verum 0 ns Fly_sp28 0 ns Fly_sp3 0.87 Rhinantus_alectorolophus 0.02 ns Meum_athamanticum 0.95 ** ns Fly_sp8 0.09 ns Platystomatidae_sp2 0 ns Heracleum_sphondylium 0.95 *** Carum_carvi 0.04 ns Pimpinella_saxifraga 0 ns Orellia_falcata 0 ns Laserpitium_latifolium 0.23 ns Scaeva_pyrastri 0 ns Phyteuma_orbiculare 0 ns Eupeodes_sp 0 ns Campanula_rapunculoides 0 ns Sphaerophoria_scripta 0 ns Campanula_rhomboidalis 0.2 ns Episyrphus_balteatus 0.39 ns Pipizella_sp 1.12 *** Eristalis_sp1 0.41 ns Empis_sp1 0.23 ns Empis_sp2 0 ns Empis_sp3 0.09 ns Achillea_millefolium 0.06 ns Leucanthemum_vulgare 0.08 ns Hieracium_isatifolium 0.01 ns Hieracium_sp 0 ns Crepis_conyzifolia 0.42 ns Taraxacum_officinale 0 ns Empididae_sp12 0 ns Tragopogon_pratensis 0 ns Empididae_sp7 0 ns Centaurea_montana 0 ns Thereva_nobilitata 0.15 ns Centaurea_scabiosa 0 ns Cryptocephalus_sp 0.13 ns Knautia_arvensis 0 ns Bruchinae_sp 0 ns Cantharis_obscura 0 ns Andrena_sp1 0 ns Andrena_sp2 1.12 *** Apis_mellifera 0 ns Ranunculus_acris 0.91 ns Ornithogalum_umbellatum 0 ns Bombus_sp1 0 ns Bombus_sp2 0 ns Philanthus_sp 0 ns Ichneumonidae_sp1 0.41 * Tenthredinidae_sp1 0.18 ns Anechura_bipunctata 0.17 ns Plant phylogeny (leaves) Herbivore phylogeny Arcyptera_fusca 0.02 ns Chorthippus_apricarius 0.07 ns Chorthippus_biguttulus 0 ns Chorthippus_scalaris 0 Geum_montanum 0.23 ns Lathyrus_pratensis 0 ns Onobrychis_montana 0.91 ** Lotus_corniculata 0.26 ns ns Gomphocerus_sibiricus 0 ns Helianthemum_grandiflorum 0 ns Chorthippus_parallelus 0.33 * Rhinanthus_alectorolephus 0.18 ns Myrmeleotettix_maculatus 0.09 ns Plantago_media 0.29 ns Omocestus_haemorrhoidalis 0.08 ns Heracleum_sphondylium 0.54 ** Stenobothrus_lineatus 0.17 ns Laserpitium_latifolium 0.40 * Stenobothrus_nigromaculatus 0.06 ns Hypochaeris_maculata 0 ns Omocestus_viridulus 0.06 ns Centaurea_uniflora 0 ns Euchorthippus_declivus 0.24 ns Vaccinium_myrtillus 0.21 ns Euthystira_brachyptera 0.37 ** Carex_sempervirens 0.10 ns Calliptamus_italicus 0.86 ns Bromus_erectus 0.83 ns Calliptamus_siciliae 1.04 *** Anthoxanthum_odoratum 0.98 * Bohemanella_frigida 1.03 *** Trisetum_flavescens 0.07 ns Podisma_pedestris 0.15 ns Sesleria_caerulea 0.68 ** Miramella_alpina 0.05 Dactylis_glomerata 0.87 ns ns Stethophyma_grossum 0 ns Poa_pratensis 1.01 *** Anonconotus_alpinus 1.04 *** Trifolium_alpinum 0 ns Decticus_verrucivorus 1.02 *** Trifolium_montanum 0 ns Metrioptera_bicolor 0 ns Metrioptera_brachyptera 0.28 ns Platycleis_albopunctata 0 ns Tettigonia_cantans 1.04 *** Tettigonia_viridissima 1.04 *** Festuca_laevigata 0 ns Festuca_rubra 0.09 ns Festuca_paniculata 0.08 ns Electronic Supplementary Material 2: Phylogenetic signal of visits of different families of insect pollinators on the plant species phylogeny. The table lists the estimated values of the univariate phylogenetic signal (λ) for each insect family, and the multivariate tests of phylogenetic signal, according to Moran's eigenvector maps and multivariate lambda. Significance levels are the following: ns (non-significant), * (p-value<0.05), ** (p-value<0.01), *** (p-value<0.001). For more details on the statistics of phylogenetic signal, see method section. λ Insect families Andrenidae 0.84 ns Apidae 0 ns Asiloidea 0.11 ns Coleoptera 0.48 ns Empididae 0.29 ns Halictidae 0.14 ns Hemiptera 0 ns Ichneumonidae 0.72 *** Lepidoptera 0 ns Muscoidea 0.89 ** Oestroidea 0 ns Syrphidae 0 ns Tenthredinoidea 1.12 *** Tephritoidea 0 ns Multivariate Moran mvM Multivariate Lambda mvλ 0.13 ** 0.01 ns Electronic Supplementary Material 3: We explored how general phylogenetic patterns of the plantpollinator network vary between the two study sites. To do so, we repeated analyses of multivariate phylogenetic signal between the two sites. For the analyses on the plant phylogeny, the study of the taxonomic PS became computationally singular due to a large number of characters (insect pollinators) compared to the species tips in the phylogeny (plant species). For the signals which remain computable, results remained qualitatively unchanged compared to the analysis of the network taken all together. Site 1 Site 2 (Guindaine) (Cours) Plant phylogeny (flowers) Site 1 Site 2 (Guindaine) (Cours) Pollinator phylogeny - plant functional traits 0.85 ** 0.89 ** - insect functional traits 1.01 *** 1.01 *** - functional niche 1.01 *** 7.4e-5 ns - functional niche 0.35 ** 0.02 ns - taxonomic niche ERR ERR - taxonomic niche 6.6e-5 ns 6.7e-5 ns ERR: indicates that the mvPS was not possible to compute (error in Laplace optimization). Electronic Supplementary Material 4: Comparison of multivariate tests of phylogenetic signal: mvM for multivariate Moran's eigenvector maps (Jombart et al. 2008 Heredity) and mvλ for multivariate lambda test (Pagel 1997, Revell 2009). Significance levels are the following: ns (non-significant), * (p-value<0.05), ** (pvalue<0.01), *** (p-value<0.001). For more details on the statistics of phylogenetic signal, see method section. mvM mvλ mvM mvλ 0.72 *** (a) Plant-pollinator network Plant features Pollinators' features - plant functional traits 0.18 ** 0.76 *** - insect functional traits 0.07 ** - functional niche 0.28 * 0.51 * - functional niche 0.06 *** 0.33 *** - taxonomic niche 0.08 * 0.16 * - taxonomic niche 0.05 ns 0.13 ns (b) Plant-herbivore network Plant features Herbivores' features - plant functional traits 0.29 ** 0.51 ** - insect functional traits 0.36 *** 0.87 *** - functional niche 0.29 * 0.76 *** - functional niche 0.30 ** - taxonomic niche 0.13 * 0 - taxonomic niche 0.17 *** 0 ns ns 0.56 **
