BD_Submission_1
advertisement

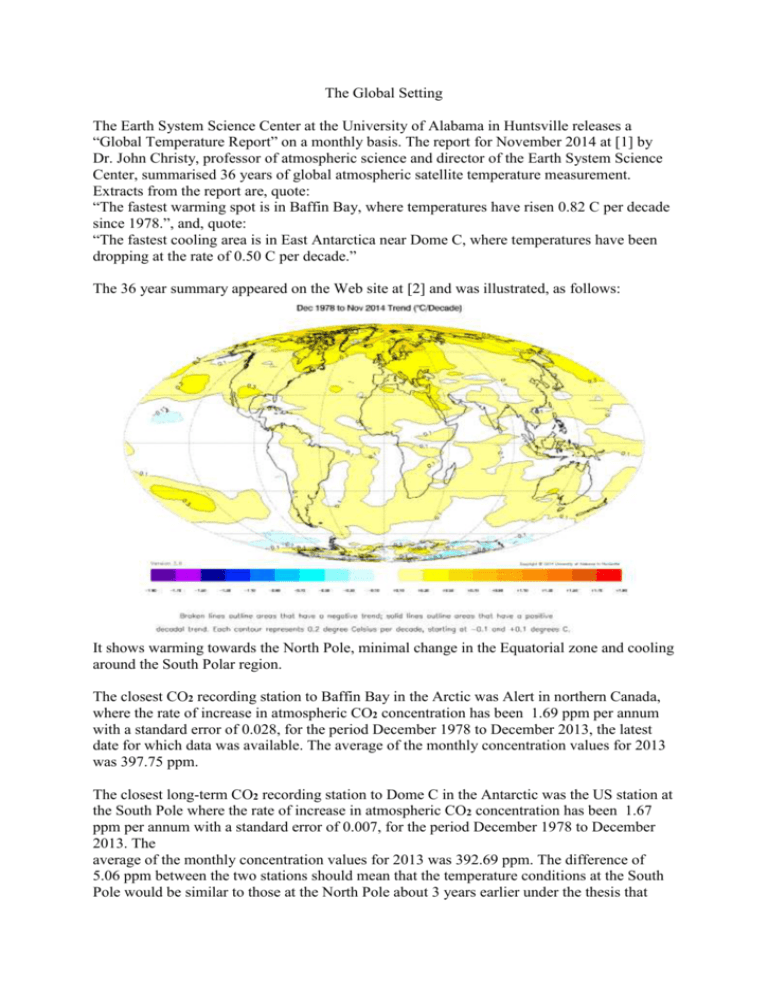
The Global Setting The Earth System Science Center at the University of Alabama in Huntsville releases a “Global Temperature Report” on a monthly basis. The report for November 2014 at [1] by Dr. John Christy, professor of atmospheric science and director of the Earth System Science Center, summarised 36 years of global atmospheric satellite temperature measurement. Extracts from the report are, quote: “The fastest warming spot is in Baffin Bay, where temperatures have risen 0.82 C per decade since 1978.”, and, quote: “The fastest cooling area is in East Antarctica near Dome C, where temperatures have been dropping at the rate of 0.50 C per decade.” The 36 year summary appeared on the Web site at [2] and was illustrated, as follows: It shows warming towards the North Pole, minimal change in the Equatorial zone and cooling around the South Polar region. The closest CO2 recording station to Baffin Bay in the Arctic was Alert in northern Canada, where the rate of increase in atmospheric CO2 concentration has been 1.69 ppm per annum with a standard error of 0.028, for the period December 1978 to December 2013, the latest date for which data was available. The average of the monthly concentration values for 2013 was 397.75 ppm. The closest long-term CO2 recording station to Dome C in the Antarctic was the US station at the South Pole where the rate of increase in atmospheric CO2 concentration has been 1.67 ppm per annum with a standard error of 0.007, for the period December 1978 to December 2013. The average of the monthly concentration values for 2013 was 392.69 ppm. The difference of 5.06 ppm between the two stations should mean that the temperature conditions at the South Pole would be similar to those at the North Pole about 3 years earlier under the thesis that increased CO2 concentration causes increased atmospheric temperature. The data for Alert and the South Pole were taken from the Web site of the World Data Centre for Greenhouse Gases at [3]. The CO2 conditions can be compared on these graphs: They have no perceptible difference in slope, that is, the rate of change of CO2 concentration with time. However there is an obvious difference in character. The Alert data shows a clear seasonal cycle with an amplitude greater than 10 ppm for each year. This is the seasonal life cycle whereby as temperature increases during Spring, life forms proliferate absorbing CO2 and causing its concentration to fall. Then in Autumn, the temperature falls, the seasonal life forms die, release CO2 and cause its concentration to rise. That is, as temperature rises CO2 concentration falls and as temperature falls CO2 concentration rises, the exact opposite of the claim by the IPCC that increased CO2 concentration causes an increase in temperature. The large seasonal amplitude at Alert relative to that at the South Pole is due to the large land mass in the Northern Hemisphere with its extensive cover of forest. The temperature conditions at the Polar Regions, taken from the Satellite Lower Tropospheric temperature data provided by the Earth System Science Center, the University of Alabama in Huntsville at [4] gave a rate of increase of 0.0444 degrees C per annum for the North Polar region for the period December 1978 to December 2013. At the South Polar region the rate of change of temperature was -0.0001 degrees C per for the same period. The difference in the temperature conditions at the two Polar regions is apparent on the preceding graphs where the rate of change of the temperature for the 35 year period has the North Polar Regions showing a rise and the South Polar Regions showing a near zero fall in lower tropospheric temperature. This is supported by satellite recording of the ground conditions which are provided by the National Snow & Ice Data Center at [5]. In the Arctic, the sea-ice extent reached a Summer minimum on September 16, 2012, of 3.41 million square kilometres, the lowest seasonal minimum since satellite recording began in 1979. Meanwhile the Antarctic sea-ice extent reached a maximum, since recording began, of 20.11 million square kilometres on September 22, 2014. Note that this is more than 2.5 times the area of the Australian continent so it not an incidental local weather effect. At its maximum it covered one twenty-fifth of the Earth’s surface. For comparison, the Observatory at Mauna Loa, Hawaii, has been the standard reference for the value of the Earth’s CO2 concentration . For the period December 1978 to December 2013, the rate of increase in CO2 concentration was 1.71 ppm per annum with a standard error of 0.012 ppm and an average for 2013 of 396.52 ppm using the data supplied by the Scripts Institute at [6]. The Satellite lower tropospheric temperature for the same period over the Tropics zone, Latitude 20 degree South to 20 degree North, increased at the rate of 0.0068 degrees C per annum. In summary, the rate of change of CO2 concentration at the Mauna Loa Observatory was greater than that at either Alert station or the South Pole by less than 2% indicating that there is little difference in the rate of change across the whole of the globe. The Observatory is on the Northern boundary of the satellite Tropics region over which there was minimal change in temperature. At the Alert station, the rate of change of CO2 concentration was less than at Mauna Loa but the nearby Baffin Bay recorded the greatest rate of increase in temperature of anywhere on the globe. At the South Pole station the rate of change of CO2 concentration was slightly less than at the Alert station but the nearby Dome C recorded the greatest rate of decrease in temperature of anywhere on the globe. This shows that the measured changes in CO2 concentration have had no detectable effect on the global temperature as demonstrated by the opposite responses for the sea-ice extent at the two Poles. This is what has happened in reality. It is not opinion, theory or computer simulation and must negate the IPCC propositions on increased CO2 concentration causing, not catastrophic climate change, but any detectable temperature change whatsoever. References: [1] http://nsstc.uah.edu/climate/2014/november2014/NOV2014GTR.pdf [2] http://wattsupwiththat.com/2014/12/03/global-temperature-report-november-2014/ [3] http://ds.data.jma.go.jp/gmd/wdcgg/ [4] http://www.nsstc.uah.edu/data/msu/t2lt/uahncdc_lt_5.6.txt [5] http://nsidc.org/arcticseaicenews/ [6] http://scrippsco2.ucsd.edu/data/in_situ_co2/monthly_mlo.csv Bevan Dockery, B.Sc.(Hons), Grad. Dip. Computing, retired geophysicist. formerly: Fellow of the Australian Institute of Geoscientists, Member of the Australian Society of Exploration Geophysicists, Member of the Society of Exploration Geophysicists, Member of the European Association of Exploration Geophysicists, Member of the Australian Institute of Mining and Metallurgy.


