H-3 Graphing Mathematical Relationships
advertisement
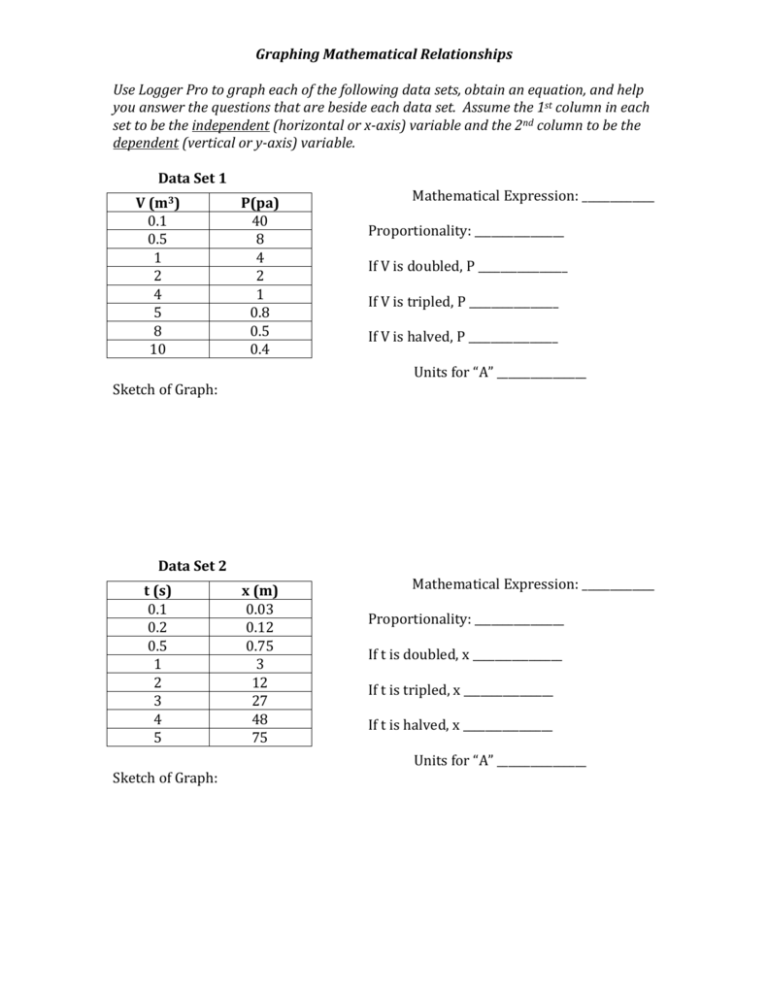
Graphing Mathematical Relationships Use Logger Pro to graph each of the following data sets, obtain an equation, and help you answer the questions that are beside each data set. Assume the 1st column in each set to be the independent (horizontal or x-axis) variable and the 2nd column to be the dependent (vertical or y-axis) variable. Data Set 1 V (m3) 0.1 0.5 1 2 4 5 8 10 P(pa) 40 8 4 2 1 0.8 0.5 0.4 Proportionality: ________________ If V is doubled, P ________________ If V is tripled, P ________________ If V is halved, P ________________ Units for “A” ________________ Sketch of Graph: Data Set 2 t (s) 0.1 0.2 0.5 1 2 3 4 5 Mathematical Expression: _____________ x (m) 0.03 0.12 0.75 3 12 27 48 75 Mathematical Expression: _____________ Proportionality: ________________ If t is doubled, x ________________ If t is tripled, x ________________ If t is halved, x ________________ Units for “A” ________________ Sketch of Graph: Data Set 3 A (months) 0 0.5 1.0 1.5 2.0 2.5 3.0 3.5 W (pounds) 0 1 2 3 4 5 6 7 Data Set 4 Sketch of Graph: Proportionality: ________________ If A is doubled, W ________________ If A is tripled, W ________________ If A is halved, W ________________ Units for “m” ________________ Sketch of Graph: t (s) 0.3 1.2 2.7 4.8 7.5 10.8 14.7 19.2 Mathematical Expression: _____________ v (m/s) 10 20 30 40 50 60 70 80 Mathematical Expression: _____________ Proportionality: ________________ If t is doubled, v ________________ If t is tripled, v ________________ If t is halved, v ________________ Units for “A” ________________
