Supplemental table S1. Baseline demographics, clinical
advertisement
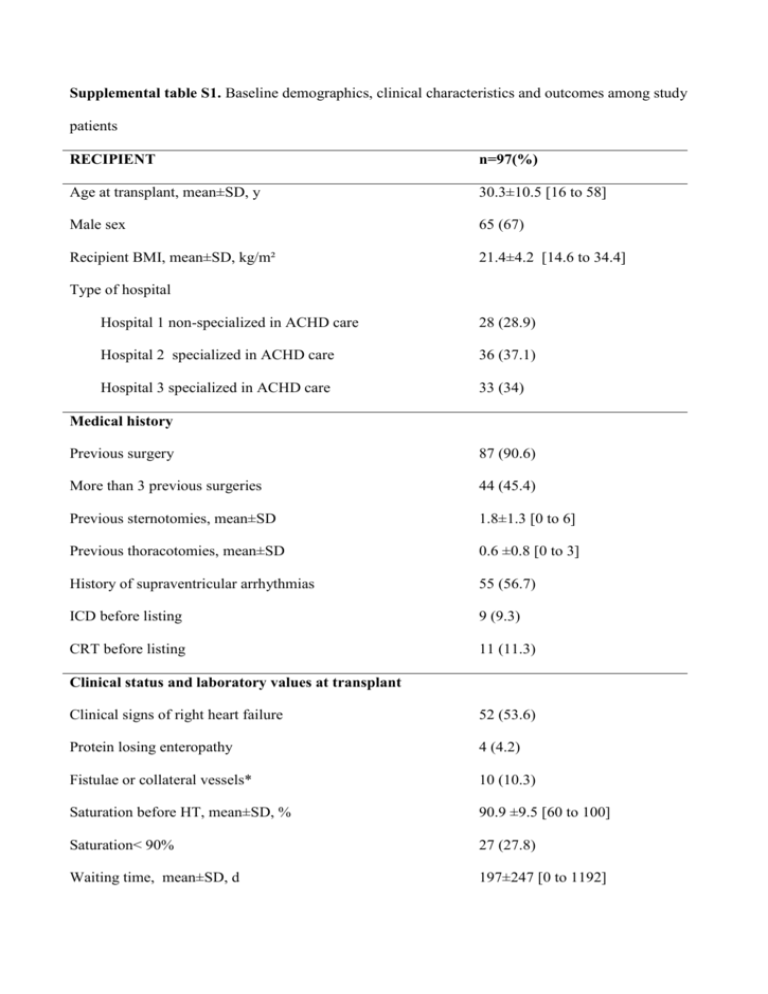
Supplemental table S1. Baseline demographics, clinical characteristics and outcomes among study patients RECIPIENT n=97(%) Age at transplant, mean±SD, y 30.3±10.5 [16 to 58] Male sex 65 (67) Recipient BMI, mean±SD, kg/m² 21.4±4.2 [14.6 to 34.4] Type of hospital Hospital 1 non-specialized in ACHD care 28 (28.9) Hospital 2 specialized in ACHD care 36 (37.1) Hospital 3 specialized in ACHD care 33 (34) Medical history Previous surgery 87 (90.6) More than 3 previous surgeries 44 (45.4) Previous sternotomies, mean±SD 1.8±1.3 [0 to 6] Previous thoracotomies, mean±SD 0.6 ±0.8 [0 to 3] History of supraventricular arrhythmias 55 (56.7) ICD before listing 9 (9.3) CRT before listing 11 (11.3) Clinical status and laboratory values at transplant Clinical signs of right heart failure 52 (53.6) Protein losing enteropathy 4 (4.2) Fistulae or collateral vessels* 10 (10.3) Saturation before HT, mean±SD, % 90.9 ±9.5 [60 to 100] Saturation< 90% 27 (27.8) Waiting time, mean±SD, d 197±247 [0 to 1192] Priority HT listing 20 (20.6) At home before HT 69 (71.1) ECMO/VAD dependent before HT 13 (13.4) Inotrope dependent before HT 20 (20.6) UNOS status 1 22 (22.7) Hematocrit before HT, mean±SD, % 45.1±9.6 [28 to 71] Hemoglobin before HT, mean±SD, g/dL 14.8 ±3.1 [9.1 to 23] Creatinine clearance < 60mL/min 16 (16.5) PER-OPERATIVE DATA Ischemic time, mean±SD, min 203±66 [74 to 355] Bypass time, mean±SD, min 198±102 [67 to 780] Prior femoral cannulation 19 (20.6) Additional surgical procedure 21 (21.6) Per HT circulatory assistance 18 (18.6) Post HT circulatory assistance 23 (23.7) Reoperation for haemostasis, mean±SD, n 0.3±0.6 [0 to 3] LONG TERM OUTCOMES Dialysis dependent 2 (2.1) Creatinine clearance at1 year after HT, mean±SD, mL/min 73±30 [14.7 to 181] Cardiac allograft vasculopathy 6 (6.2) Cancer 8 (11.1) Treated for cellular rejection 33 (56.9) Cellular rejections 1st year, n/per patient 0.9±1.6 [0 to 7] Humoral rejection 2 (3.2) Infection occurred during the 1st year 9 (11.7) Retransplantation 3 (3.1) Death (all) 44 (45.4) Early death (in-hospital mortality) 33 (34) One year death 35 (36.1) CAUSE OF DEATH (n=44) Graft dysfunction 11 (25) Haemorrhage 11 (25) Sepsis 11 (25) Rejection 2 (4.6) Stroke 2 (4.6) Others 7 (15.9) Note: Numbers in brackets indicate ranges. SD indicates standard deviation; BMI, body mass index; ICD, implantable cardioverter defibrillator; CRT, cardiac resynchronization therapy; ECMO, extracorporeal membrane oxygenation and VAD; ventricular Assist Device * Fistulae or collateral vessels: Pulmonary arteriovenous fistulae or systemic-to-pulmonary artery collateral vessels Supplemental table S2. Comparison of donors' characteristics and between the 2 eras All donors Era 1 (1988-2005) n=48 Era 2 (2006-2012) n=49 P value 38.1±14.8 [9 to 65] 34.9±15.8 41.2±13.1 0.03 Male sex 55 (58.5) 28 (59.6) 27 (55.1) 0.7 Sex mismatch 34 (36.2) 20/41.7% 14/28.6% 0.4 BMI, mean±SD, kg/m² 23.9±4.4 [15.6 to 44.2] 23.6±4.6 24.2±4.3 0.6 Need for inotropic agent 66 (89.2) 27 (87.1) 39(90.7) 0.6 Previous external massage 14 (19.2) 4 (13.3) 10 (23.3) 0.3 Age, mean±SD, y Note: Values in brackets are percentages. Numbers in brackets indicate ranges. SD indicates standard deviation; BMI, body mass index; Supplemental table S3. Pre-transplant diagnoses by era of transplant Variable Era 1 Era 2 (1988-2005) (2006-2012) n=48 (%) n=49 (%) Primary diagnosis P 0.06 D-TGA (Senning or Mustard’s procedure) 4 (8.3) 15 (30.6) 0.009 Single ventricle 10 (20.8) 5 (10.2) 0.17 Tricuspid atresia 8 (16.7) 5 (10.2) 0.39 TOF 8 (16.7) 4 (8.2) 0.23 Double outlet left ventricle 4 (8.3) 7 (14.3) 0.52 Congenital valvular disease 7 (14.6) 4 (8.2) 0.32 Congenitally Corrected TGA 5 (10.4) 2 (4.1) 0.27 Ventricular septal defect 1 (2.1) 2 (4.1) 1 Pulmonary atresia with intact ventricular septum 0 2 (4.1) 0.5 TOF with pulmonary atresia 0 1 (2.0) 1 Others (miscellaneous) 1 (2.1) 2 (4.1) 1 24 (50) 19 (38.8) 0.27 Univentricular anatomy (versus biventricular) Complexity of CHD Note: Values in brackets are percentages. TGA, transposition of the great arteries; TOF, tetralogy of Fallot 0.05 Supplemental table S4. Multivariable factors associated with 1-year mortality after HT in era 1 and era 2 Variable OR (95% CI) p value Age at listing for HT 1.096 (1.007-1.193) 0.033 Male sex 0.179 (0.038-0.853) 0.031 Biventricular anatomy 0.102 (0.015-0.712) 0.021 Reoperation for hemostasis 8.559 (1.422-51.523) 0.019 8.171 (2.125-31.422) 0.002 HT in era 1 (1988-2005) HT in era 2 (2006-2012) Post HT circulatory assistance OR, odds ratio; CI confidence interval

