Physical Variables Used to Measure Motion
advertisement
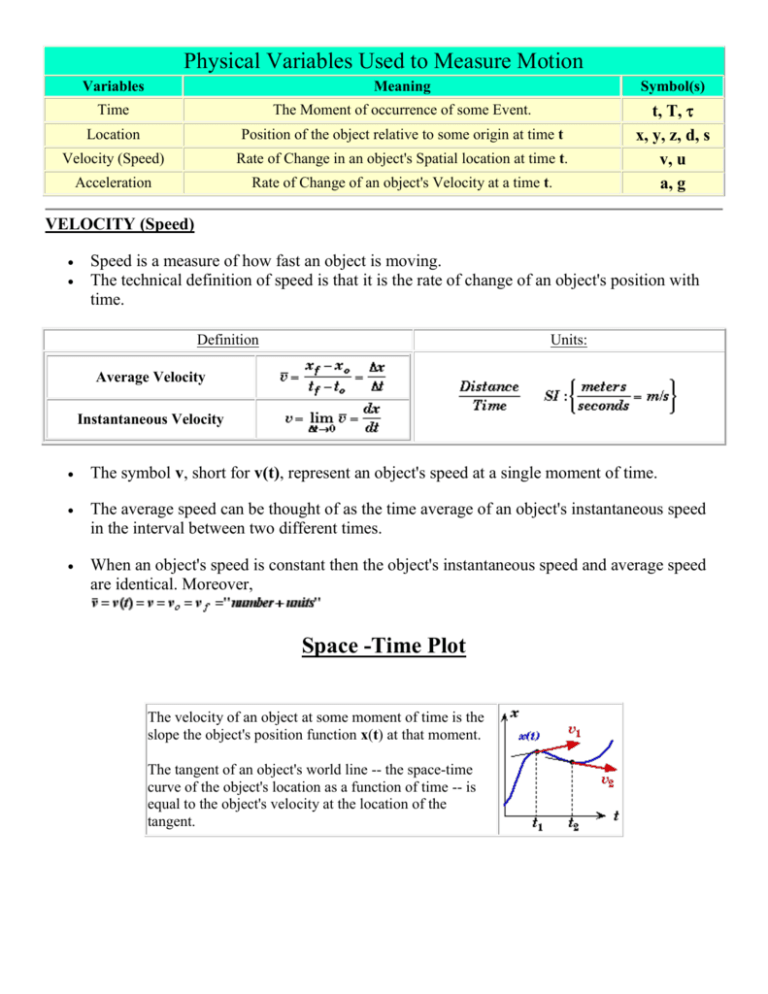
Physical Variables Used to Measure Motion Variables Meaning Symbol(s) Time The Moment of occurrence of some Event. Location Position of the object relative to some origin at time t Velocity (Speed) Rate of Change in an object's Spatial location at time t. Acceleration Rate of Change of an object's Velocity at a time t. t, T, x, y, z, d, s v, u a, g VELOCITY (Speed) Speed is a measure of how fast an object is moving. The technical definition of speed is that it is the rate of change of an object's position with time. Definition Units: Average Velocity Instantaneous Velocity The symbol v, short for v(t), represent an object's speed at a single moment of time. The average speed can be thought of as the time average of an object's instantaneous speed in the interval between two different times. When an object's speed is constant then the object's instantaneous speed and average speed are identical. Moreover, Space -Time Plot The velocity of an object at some moment of time is the slope the object's position function x(t) at that moment. The tangent of an object's world line -- the space-time curve of the object's location as a function of time -- is equal to the object's velocity at the location of the tangent. ACCELERATION Acceleration measures how fast an object's speed is getting faster (or slower if negative). Technically, the acceleration of an object is the rate of change of an object's Speed with time. Definition: Units: Average Acceleration Instantaneous Acceleration The acceleration is Not a measure of the rate of movement of and object in space. It measures how fast an object's speed is getting faster (or slower). In fact it is possible for an object to be at rest at some moment and till have an acceleration even though it has no speed at that moment. Calculus Relationship An object's instantaneous acceleration function a(t) is the derivative of the object's velocity function v(t) with respect to time. Velocity-Time Plot The acceleration of an object at some moment "t" is the slope of the object's velocity function v(t) at that moment. This means that a(t) at t is tangent to velocity versus time curve. Simplified approximations for constant acceleration useful for physical modeling: Given the definition of velocity as time. write an expression for position as a function of vav and Given the definition of average implies that that the average velocity must just be: vav = (vf + vi )/ 2 write an expression for position as a function of vi, vf and t. Given the definition of acceleration as acceleration. write an expression for vf as a function of time and Given the two expressions you just developed, write an expression for position as a function of time, xi and vi Finally combine the above results to write an expression for velocity as a function of acceleration and position that eliminates time. Vertical Ball Toss One student stands on the top a 45.0 m building on a planet where the gravitational acceleration is 10 m/s2 down. Another student stands on the ground and throws a ball vertically to the student on the top of the building who reaches out to catch the ball. Neglecting the height of the students: (A) What is the minimum vertical speed at which the ball must be launched so that it just reaches the student on the top of the building ? (B) How long will it take the ball to rise to its highest point (the top of the building) after it is launched ? (C) What is the speed of the ball when it has risen to half its maximum height ? (D) If the ball is not caught, what is the speed and direction of the ball 4.40 seconds after it was launched ? Of course none of this works for orbital mechanics beyond VERY short time scales as accelerations are always changing!!! General Problem Solving Strategy for Kinematics Problems. 1. Divide the problem up into parts and make a Sketch for each part. (real world representation). 2. Write your Knowns and Unknowns in a table with a column for each part of the problem. 3. Draw QUALITATIVE Graphs for position, velocity and acceleration 4. Write equations for the motion from the graphs. (Look for the graph that is simplest and write an equation for it. Then use the integral and derivative rules to write equations for the rest.) 5. Algebraically rewrite your equations for the unknown variables based on the unknowns you identified in the table. 6. Plug in numbers and Solve for the unknowns. it is reasonable. Be sure to evaluate your answer to see if Example: A rocket is launched from earth such that its acceleration starts out at 4 m/s2 and decreases linearly to -9.8m/s2 over 30 seconds. Makes graphs for acceleration vs time, velocity vs time and position vs time. What is the maximum height of the rocket? How much time elapses before it hits the ground? A golf ball is dropped in vacuum from a height of 5 meters into a column of oil. As the ball falls through the column of oil its position vs. time graph looks like the one shown. 6 5 4 3 2 1 0 0 0.5 1 1.5 2 2.5 And its velocity vs. time graph looks like this 2 1.5 1 0.5 0 -0.5 0 0.5 1 1.5 2 2.5 -1 -1.5 -2 Draw a quantitatively correct acceleration vs. time graph. Now this works fine for toy models, but we need computational tools for motion that can’t be described analytically.

