Lesson plan
advertisement
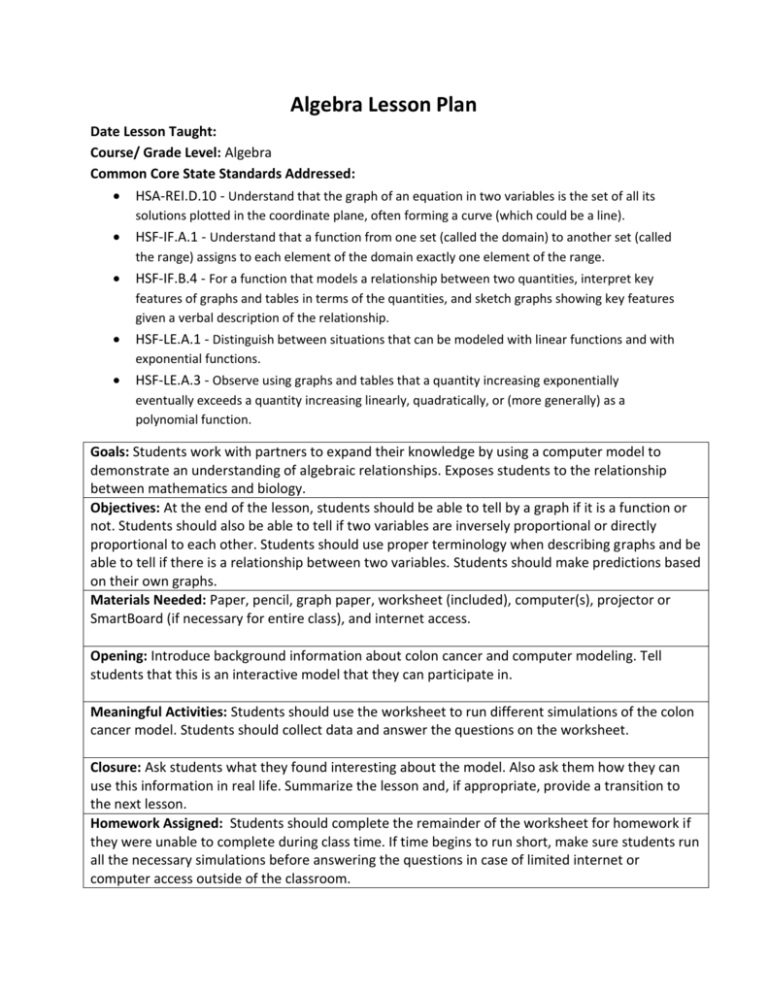
Algebra Lesson Plan Date Lesson Taught: Course/ Grade Level: Algebra Common Core State Standards Addressed: HSA-REI.D.10 - Understand that the graph of an equation in two variables is the set of all its solutions plotted in the coordinate plane, often forming a curve (which could be a line). HSF-IF.A.1 - Understand that a function from one set (called the domain) to another set (called the range) assigns to each element of the domain exactly one element of the range. HSF-IF.B.4 - For a function that models a relationship between two quantities, interpret key features of graphs and tables in terms of the quantities, and sketch graphs showing key features given a verbal description of the relationship. HSF-LE.A.1 - Distinguish between situations that can be modeled with linear functions and with exponential functions. HSF-LE.A.3 - Observe using graphs and tables that a quantity increasing exponentially eventually exceeds a quantity increasing linearly, quadratically, or (more generally) as a polynomial function. Goals: Students work with partners to expand their knowledge by using a computer model to demonstrate an understanding of algebraic relationships. Exposes students to the relationship between mathematics and biology. Objectives: At the end of the lesson, students should be able to tell by a graph if it is a function or not. Students should also be able to tell if two variables are inversely proportional or directly proportional to each other. Students should use proper terminology when describing graphs and be able to tell if there is a relationship between two variables. Students should make predictions based on their own graphs. Materials Needed: Paper, pencil, graph paper, worksheet (included), computer(s), projector or SmartBoard (if necessary for entire class), and internet access. Opening: Introduce background information about colon cancer and computer modeling. Tell students that this is an interactive model that they can participate in. Meaningful Activities: Students should use the worksheet to run different simulations of the colon cancer model. Students should collect data and answer the questions on the worksheet. Closure: Ask students what they found interesting about the model. Also ask them how they can use this information in real life. Summarize the lesson and, if appropriate, provide a transition to the next lesson. Homework Assigned: Students should complete the remainder of the worksheet for homework if they were unable to complete during class time. If time begins to run short, make sure students run all the necessary simulations before answering the questions in case of limited internet or computer access outside of the classroom. Differentiation: Decide if it is appropriate for the students to work in small groups or as individuals. Teacher can adjust the worksheet if need or if enough time is not permitted. Assessment: The worksheet can be graded for correctness and completion. Students may wish to share any interesting discoveries from the model with the class. References: National Governors Association Center for Best Practices, Council of Chief State School Officers, Common Core State Standards (Mathematics), National Governors Association Center for Best Practices, Council of Chief State School Officers, Washington D.C., (2010).

