pbi12358-sup-0001-FigS1-S3-Tab1-S2
Supporting information for
Arabidopsis EDT1/HDG11 improves
drought and salt tolerance in cotton and poplar and increases cotton yield in the field by Yu et al.
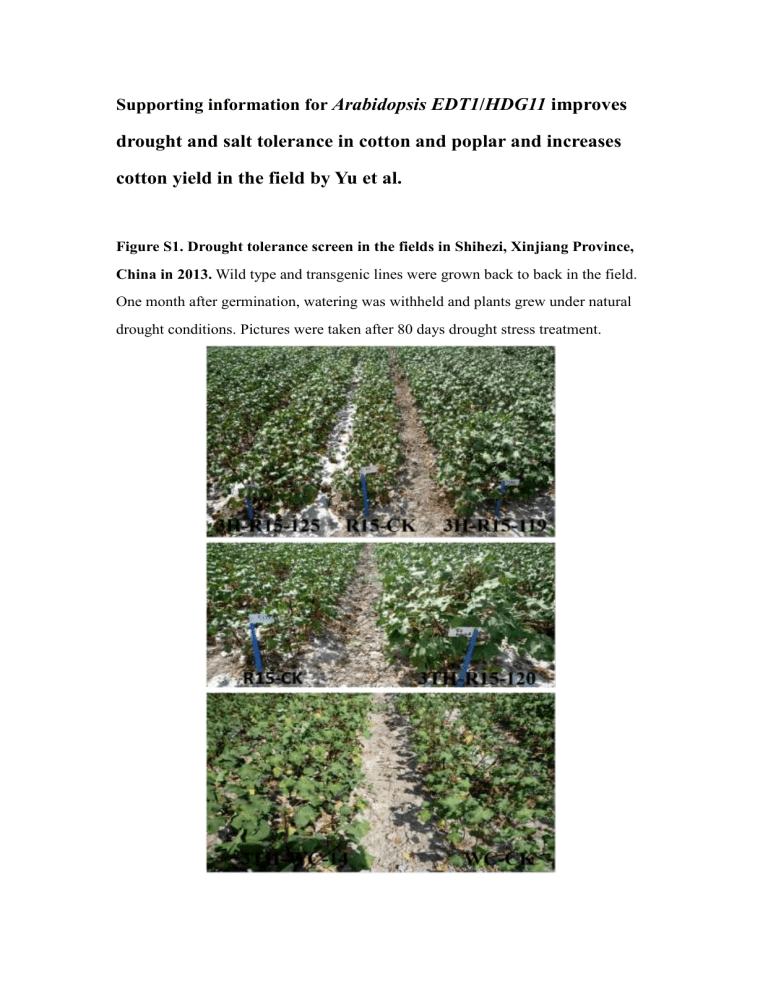
Figure S1. Drought tolerance screen in the fields in Shihezi, Xinjiang Province,
China in 2013.
Wild type and transgenic lines were grown back to back in the field.
One month after germination, watering was withheld and plants grew under natural drought conditions. Pictures were taken after 80 days drought stress treatment.
Figure S2. Seed cotton yield of different transgenic lines grown in the drought stressed fields in 2014. The field trials were carried out from April to September of
2014 in Shihezi, Xinjiang Province, China.
This field trial consists of three replica plots of about 18 m 2 each for each line. The inter-row spacing was 30 cm and inter-plant spacing was 12.5 cm. One month after germination when seedlings were established, watering was withheld and plants grew under natural drought conditions during the rest of the growing season.
Figure S3. The expression levels of GhHOX3 in response to drought treatment.
7-day-old WC cotton plants grown under controlled conditions were pulled out from wet vermiculite and exposed to drought in the air under controlled conditions with 40% relative humidity, 25
℃
. The seedling of each indicated time points were harvested for total RNA extraction. Quantitative real-time reverse transcription PCR were carried out to test how GhHOX3 expressed after drought stress. A drought-induced gene GhDREB2B (GQ848094) was used as a positive control. The G. hirsutum histone-3 gene ( GhHIS3 ) was used as an internal control. Values are mean ± SD of three replica experiments.
Table S1.
Agronomic traits of different transgenic lines grown in the drought stressed fields in Shihezi, Xinjiang Province, China in 2013.
Genotype Plant height
(cm)
3TH-R15-120 45.25 ± 3.75
3TH-R15-39
3H-R15-125
3H-R15-119
48.36 ± 8.76
50.20 ± 5.71
**
47.87 ± 4.89
Fruit branch number(/plant)
4.10 ± 0.88
***
3.70 ± 1.70
*
4.40 ± 1.03
*
3.70 ± 0.95
**
3TH-R15-146 52.19 ± 4.83
*** 3.60 ± 0.0.97
*
R15-CK
3TH-WC-14
WC-CK
45.39 ± 3.56
48.06 ± 5.15
*
44.82 ± 2.66
2.70 ± 0.67
5.10 ± 0.70
*
3.00 ± 0.71
Boll number
(/plant)
4.10 ± 0.88
***
3.50 ± 1.35
*
4.80 ± 1.14
*
3.60 ± 1.17
*
3.70 ± 0.97
*
2.20 ± 0.70
5.50 ± 0.52
*
3.00 ± 0.41
Table S2. Primers used in this study.
Primer Sequence Purpose
AtHDG11
AtHDG11
GhHis3
GhHis3
-LP
-RP
-LP
-RP
5’-CGGTGGTGGTAGTCATCATCA-3’
5’-TAACAGGAGGACCTCCACAGT-3’
5’-TGGGAAGGCTCCAAGGAAGCA-3’
5’-CGAGCCAACTGGATGTCCTTG-3’
Histone-LP
Histone-RP
5’-CTCTCCCTTTGGTTTCCGAG-3’
5’-AACATCCATGGCAGTCACAGT-3’
GhHOX3 -qPCR LP
GhHOX3 -qPCR RP
5’-ATTATGAATGGCTTAGCTTTGG-3’
5’-ACTGCGTTGCCGTTGGATAG-3’
GhDREB2B -qPCR LP 5’-CCCACCTCAAGCACCAAGGA-3’
RT-PCR
RT-PCR
RT-PCR
RT-PCR
RT-PCR
RT-PCR qRT-PCR qRT-PCR qRT-PCR
GhDREB2B -qPCR RP 5’-TTGAATCGGGAACAGAACAGC-3’
GhHIS3 -qPCR-LP qRT-PCR
5’-GGCATACCTTGTGGGTCTTTTTGA-3’ qRT-PCR
GhHIS3 -qPCR-RP 5’-CTACCACTACCATCATGGC-3’ qRT-PCR
