assignment 1 f11 sol..
advertisement
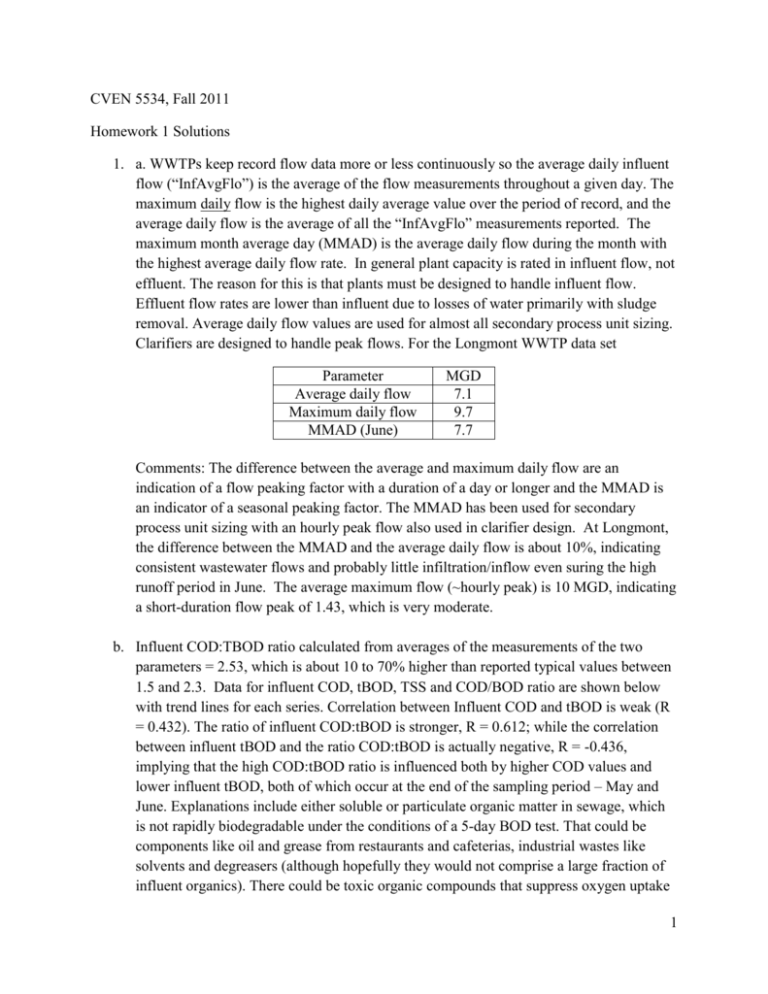
CVEN 5534, Fall 2011 Homework 1 Solutions 1. a. WWTPs keep record flow data more or less continuously so the average daily influent flow (“InfAvgFlo”) is the average of the flow measurements throughout a given day. The maximum daily flow is the highest daily average value over the period of record, and the average daily flow is the average of all the “InfAvgFlo” measurements reported. The maximum month average day (MMAD) is the average daily flow during the month with the highest average daily flow rate. In general plant capacity is rated in influent flow, not effluent. The reason for this is that plants must be designed to handle influent flow. Effluent flow rates are lower than influent due to losses of water primarily with sludge removal. Average daily flow values are used for almost all secondary process unit sizing. Clarifiers are designed to handle peak flows. For the Longmont WWTP data set Parameter Average daily flow Maximum daily flow MMAD (June) MGD 7.1 9.7 7.7 Comments: The difference between the average and maximum daily flow are an indication of a flow peaking factor with a duration of a day or longer and the MMAD is an indicator of a seasonal peaking factor. The MMAD has been used for secondary process unit sizing with an hourly peak flow also used in clarifier design. At Longmont, the difference between the MMAD and the average daily flow is about 10%, indicating consistent wastewater flows and probably little infiltration/inflow even suring the high runoff period in June. The average maximum flow (~hourly peak) is 10 MGD, indicating a short-duration flow peak of 1.43, which is very moderate. b. Influent COD:TBOD ratio calculated from averages of the measurements of the two parameters = 2.53, which is about 10 to 70% higher than reported typical values between 1.5 and 2.3. Data for influent COD, tBOD, TSS and COD/BOD ratio are shown below with trend lines for each series. Correlation between Influent COD and tBOD is weak (R = 0.432). The ratio of influent COD:tBOD is stronger, R = 0.612; while the correlation between influent tBOD and the ratio COD:tBOD is actually negative, R = -0.436, implying that the high COD:tBOD ratio is influenced both by higher COD values and lower influent tBOD, both of which occur at the end of the sampling period – May and June. Explanations include either soluble or particulate organic matter in sewage, which is not rapidly biodegradable under the conditions of a 5-day BOD test. That could be components like oil and grease from restaurants and cafeterias, industrial wastes like solvents and degreasers (although hopefully they would not comprise a large fraction of influent organics). There could be toxic organic compounds that suppress oxygen uptake 1 during the BOD test. Again one would hope not in the concentration that would produce a lower than actual BOD. One of the students in class last year, Mitch Clement, offered an interesting hypothesis: that the readily degradable matter in the sewage was degraded in the sewer before it reached the plant, and supported his explanation by evaluating the association of the COD:TBOD to flow. That correlation coefficient is positive between COD:tBOD and the influent flow rate, but not high, R = 0.30. However, the seasonality of the drop in influent tBOD (in warmer months) supports that biodegradation in the sewer could be higher due to warmer temperatures. Inf COD mg/L Inf TSS (mg/L) 7 per. Mov. Avg. (Inf COD mg/L) 7 per. Mov. Avg. (Inf TSS (mg/L)) 1600 1400 Inf tBOD mg/L 4.50 Inf COD/tBOD 7 per. Mov. Avg. (Inf tBOD mg/L) 4.00 7 per. Mov. Avg. (Inf COD/tBOD) 3.50 3.00 1000 2.50 800 2.00 600 Inf COD/tBOD Inf COD, tBOD, TSS (mg/L) 1200 1.50 400 1.00 200 0.50 0 0.00 1 16 31 46 61 76 91 106 121 136 151 166 181 2 c. Graph of total effluent ammonia (NH4-N + NH3-N) daily and 30-day average values are shown below. LWWTP Effluent Total Ammonia Total Ammonia (mg/L as N) 9 Total NH3-N 8 30-d avg total NH3-N 7 6 5 4 3 2 1 0 12/18/2008 2/6/2009 3/28/2009 5/17/2009 7/6/2009 8/25/2009 General formula for going from water quality standard to permit limits: 𝐶𝑑𝑠 𝑄𝑑𝑠 − 𝐶𝑢𝑠 𝑄𝑢𝑠 𝐶𝑤 = 𝑄𝑤 Where Cw and Qw are wastewater treatment plant ammonia-nitrogen species concentration and plant normalized effluent flow rate, respectively; Cus and Qus are ammonia-nitrogen species concentration and normalized stream flow rate upstream of the plant discharge, respectively; Cds and Qds are ammonia-nitrogen species concentration and normalized flow rate downstream (after discharge), respectively. The condition of Longmont’s permit is that they must report the highest daily average ammonia for any month. Upstream total ammonia-N (mg/l)1 0.53 1 Upstream unionized NH3-N (mg/l) 0.026 Acute Water quality standard total ammonia (Cds, mg/l) 8.4 Chronic Water Quality standard unionized ammonia (Cds, mg/l) 0.06 WWTP average total ammonia-nitrogen (mg/l) 1.13 WWTP maximum 30-day average total ammonia-nitrogen (mg/l) 1.56 Calculated WWTP avg unionized NH3-N (mg/l) 0.07 Calculated WWTP max. 30-day average unionized NH3-N (mg/l) 0.09 1 average from CDPHE stream water quality sampling, LWWTP permit rationale. 3 Comparison of seasonal permit limit for ammonia and reported effluent concentration. Month Permit limit 2009 highest actual daily value used for (total ammonia N, mg/l) reporting (total ammonia N, mg/l) Jan, Feb, Dec 7.4 1 (Jan, Feb, Dec) Mar, Apr, Aug, Sep 5.1 2.1 (Mar), 7.74 (Apr – violation), no data (Aug, Sep) May, Jun, July 4.4 1.42 (May), 1 (June, July) Oct., Nov. 6.5 (no data) Normalized flows: Qw = 1; Qus = 0.54 (low flow condition), Qds = 1.54 To meet acute standard = 8.4 mg/L total ammonia nitrogen, 30-day average effluent ammonia nitrogen must be less than: 𝐶𝑤 = 8.4 ∗ 1.54 − 0.53 ∗ 0.54 = 12.6 𝑚𝑔/𝑙 1 This is no problem for the Longmont WWTP to meet the acute WQS for ammonia. This highest ever reported daily value for total ammonia nitrogen is 7.74 mg/l, and more relevant to the permit, the highest 30-day average value was 1.56 mg/l, significantly below where a WQSbased effluent limit would be set. The chronic standard is another story. 𝐶𝑤 = 0.06 ∗ 1.54 − 0.026 ∗ 0.54 = 0.08 𝑚𝑔/𝑙 1 The chronic limit would be associated with a total effluent ammonia limit of 1.3 mg/l. The plant average total ammonia nitrogen is 1.1 mg/l about 15% less than the WQBEL. More important their 30-day average total ammonia nitrogen exceeded the WQBEL for 29 days in April-May 2009 due to a process upset. Overall, in 190 days of data collection, they daily average exceed the chronic limit 20 days, ~10% of the time. Meeting a new WQBEL based on the chronic ammonia standard could be very problematic for the plant, especially if the permit still required meeting the limit every day, rather than a 7- or 30-day average.. d. For nitrate, the upstream average nitrate-nitrogen concentration is 3.2 mg/l, and the calculated new WQBEL for NO3-N is: 𝐶𝑤 = 10 ∗ 1.54 − 3.2 ∗ 0.54 = 13.7 𝑚𝑔/𝑙 1 4 The 30-day average for NO3-N exceeded 13.7 mg/l for 25 days in April 2009, not surprisingly when ammonia was low. Also, the overall average effluent NO3-N for the entire data period was 13 mg/l – only 5% lower than the standard. Moreover, the 30-day average effluent nitrate nitrogen exceeded the WQBEL of 13.7 mg/l on 25 days in April 2009. With current treatment, the plant is in kind of a double bind. As they get better at meeting stringent ammonia WQBEL, their nitrate levels will increase. If a 10 mg/l NO3-N WQS were adopted – for example if there was a possibility for the St. Vrain getting a designated use as a drinking water supply, it would be very difficult for the Longmont WWTP to meet the new WQBEL for nitrate. Effluent ammonia and nitrate nitrogen 18 Effluent NH4- and NO3-N (mg/l) 16 14 12 10 8 6 EffNH3N mg/L 4 EffNO3 mg/L 2 0 1 16 31 46 61 76 91 106 121 136 151 166 181 e. Effluent fecal coliform has two permit limits: 30-day average < 251 CFU/100 ml and 7day average < 502 CFU/100 ml. The plant would have no problem meeting either of these standards, as well as new standards based on E. coli, by either conversion estimation method. 5 WWTP Data Plant effluent fecal coliform (avg CFU/100 ml) Plant effluent fecal coliform (max 30-d avg CFU/100 ml) Plant effluent fecal coliform (max 7-d avg CFU/100 ml) Fecal Coliform 28 E. coli (0.63 conversion) 18 E. coli (0.77 conversion) 22 60 38 46 117 74 90 Estimated discharge E. coli limits for 30-day average based on conversion of 251 CFU/100 ml fecal coliform limit would be 158 CFU/100 ml or 193 CFU/100 ml, depending on which conversion factor was used. For the 7-day average effluent limit, 502 CFU/100 ml fecal coliform, the new 7-day averages would be316 CFU/100 ml or 387 CFU/100 ml depending on which conversion factor was used. In all cases: 30-day and 7-day average effluent limits, regardless of conversion factor used to estimate E. coli, the Longmont WWTP would have no problem meeting an E. coli based limit, just as it has no problem meeting the current fecal coliform limit. 6 2. Factors to consider (by no means an exhaustive list). Technology-based effluent limits (TBELs): Merits Typically national standards which are uniform and easy to understand (and hard to contest) Achievable with available technology which could consider secondary and tertiary treatment Historically have produced improved water quality Consistency produces equal cost burdens on public treatment works Non-point source pollution not factored in – WWTPs responsible only for their own effluent Some improvements such as energy conservation, nutrient recovery, are technology based and could be encourage by TBELs Water quality-based effluent limits (WQBELS) Merits Based on scientific knowledge of physical, chemical, biological, ecological factors in particular stream Incorporate designated use for most waters (except antidegradation waters) which recognizes human factors WQBELs can change to incorporate new science Could inspire new technology based on emerging standards or contaminants Adding new contaminants can be done on a local level Non-point source (NPS) pollution may be factored in explicitly Problems Do not consider unique receiving water conditions May induce complacency with current technology May not protect very high quality waters with anti-degradation goals May not be easy to lower standards once they are set New designated uses such as water reuse are hard to add into permit limits. They become voluntary Problems Require significant investment in research and many factors and combination of factors may be neglected. Example, alkalinity significantly changes toxicity of heavy metals. Changes to designated use offers opportunity to downgrade receiving water quality due to economic or social pressure Frequent changes (e.g., over 5- or 7-year permit cycle can impose significant hardship on WWTPs where major process changes take place over decadal or longer cycles. Research costs linking contaminants to impacts would be borne locally Utilities bear the cost burden of NPS 7
