Chapter 7
CFIN4
Chapter 7 Solutions
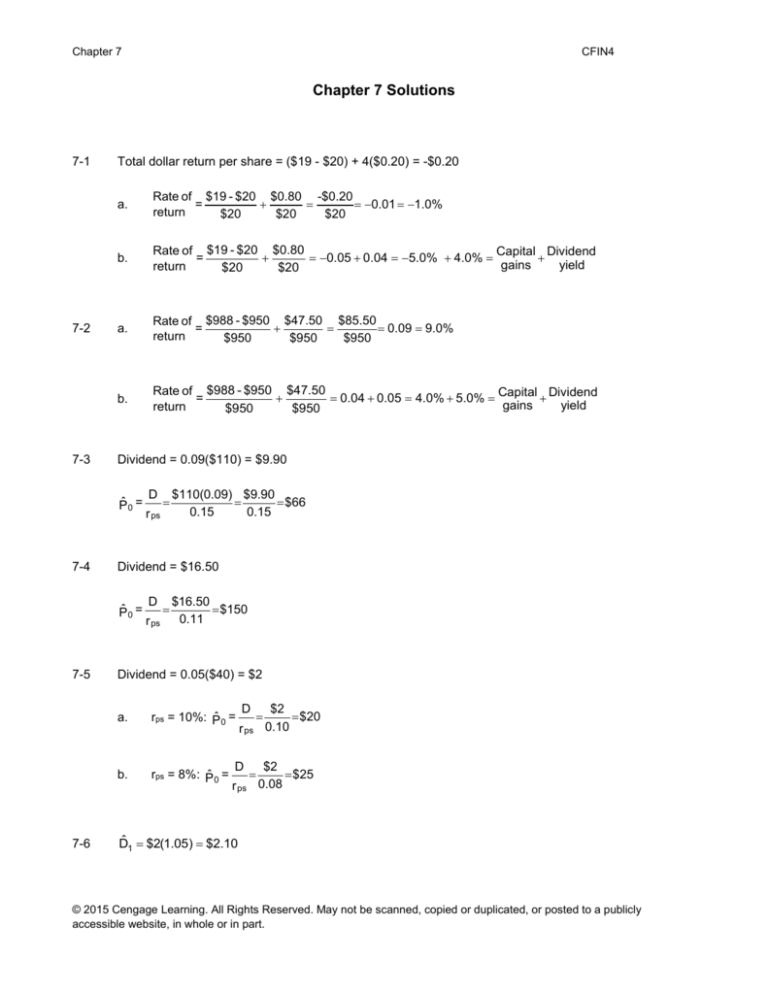
7-1
7-2
7-3
Total dollar return per share = ($19 - $20) + 4($0.20) = -$0.20
a.
Rate of $19 - $20 $0.80 -$0.20
=
0.01 1.0%
return
$20
$20
$20
b.
Rate of $19 - $20 $0.80
Capital Dividend
=
0.05 0.04 5.0% 4.0%
gains
yield
return
$20
$20
a.
Rate of $988 - $950 $47.50 $85.50
=
0.09 9.0%
return
$950
$950
$950
b.
Rate of $988 - $950 $47.50
Capital Dividend
=
0.04 0.05 4.0% 5.0%
gains
yield
return
$950
$950
Dividend = 0.09($110) = $9.90
Pˆ 0 =
7-4
7-6
r ps
$110(0.09) $9.90
$66
0.15
0.15
Dividend = $16.50
Pˆ 0 =
7-5
D
D
r ps
$16.50
$150
0.11
Dividend = 0.05($40) = $2
a.
rps = 10%: Pˆ 0 =
b.
rps = 8%: Pˆ 0 =
D
r ps
D
r ps
$2
$20
0.10
$2
$25
0.08
D̂1 $2(1.05) $2.10
© 2015 Cengage Learning. All Rights Reserved. May not be scanned, copied or duplicated, or posted to a publicly
accessible website, in whole or in part.
Chapter 7
CFIN4
ˆ1
(1 + g) $2.00(1.05) $2.10
D
= D0
$30
Pˆ 0 =
0.12 .05
0.07
rs - g
rs - g
7-7
D̂1 $3(1.04) $3.12
ˆ1
(1 + g) $3.00(1.04) $3.12
D
= D0
$52
Pˆ 0 =
g
0.10 .04
0.06
rs
rs - g
7-8
D̂1 $1.20(1.025) $1.23
ˆ1
(1 + g) $1.20(1.025) $1.23
D
= D0
$9.84
Pˆ 0 =
g
0.15 .025 0.125
rs
rs - g
7-9
rs
= Dividend yield + Capital gains yield
=
8%
+
6%
= 14%
ˆ1
$1.06
D
=
$13.25
Pˆ 0 =
g
0.14
0.06
rs
Alternative solution:
Dividend D̂1
yield
P0
0.08
P0
7-10
$1.06
P0
$1.06
$13.25
0.08
rs = 16%
g = ?, but we know the price of the stock is P0 = $19.50
D̂1 $2.34
We can solve for g as follows:
© 2015 Cengage Learning. All Rights Reserved. May not be scanned, copied or duplicated, or posted to a publicly
accessible website, in whole or in part.
Chapter 7
CFIN4
P0
$19.50
D̂1
rs g
$2.34
0.16 g
Solving for g, we find the growth rate to be 4 percent:
$19.50(0.16 – g) = $2.34
$3.12 – $19.50g = $2.34
g = ($3.12 - $2.34)/$19.50 = 0.04 = 4%.
The next step is to use the growth rate to project the stock price five years hence:
P̂5
D0 (1 g)6 D1(1 g)5
rs g
rs g
$2.34(1.04)5 $2.847
$23.72
0.16 0.04
0.12
Therefore, Ocala Company’s expected stock price five years from now, P̂5 , is $23.72.
Alternative solution: Because the growth rate will remain constant at 4 percent, the stock price should
increase by 4 percent each year. Thus, the stock price in Year 5 can be computed as:
P̂5 $19.50(1.04)5 $19.50(1.21665) $23.72
7-11
D0 = D̂1 = $0
D̂ 2 = $0.50; this actually is the first dividend that is affected by constant growth (g norm = 6%), thus it can
be used to compute the price of the stock at the end of the non-constant growth period.
P̂1
D̂2
$0.50
$6.25
rs gnorm 0.14 0.06
Thus, the current price of the stock is
P0
ˆ Pˆ
D
1
1
(1 rs )
1
$0 $6.25
(1.14)1
$6.25(0.87719) $5.4825 $5.48
Cash flow time line for this scenario:
© 2015 Cengage Learning. All Rights Reserved. May not be scanned, copied or duplicated, or posted to a publicly
accessible website, in whole or in part.
Chapter 7
CFIN4
0
1
2
…
3
rs = 14%
gnorm = 6%
0.00
0.50
6.25 Pˆ1
5.4825
6.25
0.53
∞
0.50(1.06)∞-2
D̂2
0.50
rs gnorm 0.14 .06
Alternative Solution:
Students might solve the problem by computing the price at the end of Year 2, because they believe
that the first year of constant growth is in Year 3. The solution in this case would be:
D̂ 3 = $0.50(1.06) = $0.53
P̂2
P0
D̂3
$0.53
$6.625
rs gnorm 0.14 0.06
ˆ
D
1
(1 rs )
1
ˆ Pˆ
D
2
2
(1 rs )
2
$0
1
(1.14)
$0.50 $6.625
(1.14)2
$0 $7.125(0.76947) $5.4825 $5.48
Cash flow time line for this scenario:
0
1
2
3
rs = 14%
gnorm = 6%
0.00
P0
7-12
0.50
0.53
6.625 Pˆ2
D̂2
0.53
rs gnorm 0.14 .06
7.125
5.4825
7.125
(1.14)2
…
∞
0.50(1.06)∞-2
5.4825
D0 = $0
ˆ D
ˆ D
ˆ $0
D
1
2
3
D̂4 = $3.00; this actually is the first dividend that is affected by constant growth, which equals 0 percent
(g = 0%), thus it can be used to compute the price of the stock at the end of the nonconstant growth period.
© 2015 Cengage Learning. All Rights Reserved. May not be scanned, copied or duplicated, or posted to a publicly
accessible website, in whole or in part.
Chapter 7
CFIN4
P̂3
D̂4
$3.00
$30.00
rs gnorm 0.10 0
Thus, the current price of the stock is
P0
P̂3
(1 rs )
3
$30.00
(1.10)3
$30.00(0.751315) $22.5394 $22.54
Cash flow time line:
0
1
2
3
4
rs = 10%
0.00
0.00
0.0000
0.00
3.00
…
gnorm = 0%
∞
3.00
D̂4
3.00
30.00 Pˆ3
rs gnorm 0.10 0
30.00
22.5394
22.5394
Alternative Solution:
Students might solve the problem by computing the price at the end of Year 4, because they believe
that the first year of constant growth is in Year 4. The solution in this case would be:
D̂4 = $3.00
P̂4
P̂0
7-13
D̂5
$3.00
$30
rs gnorm 0.10 0
ˆ Pˆ
D
4
4
(1 rs )
4
$3.00 $30.00
(1.10)4
$33(0.68301) $22.5394 $22.54
D0 = $1.00
D̂1 = D̂ 2 = $1.00
D̂ 3 = $1.00(1.08) = $1.08; this is the first dividend that is affected by constant growth (g norm = 8%), thus it
can be used to compute the price of the stock at the end of the non-constant
growth period.
P̂2
D̂3
$1.08
$1.08
$12.00
rs gnorm 0.17 0.08 0.09
© 2015 Cengage Learning. All Rights Reserved. May not be scanned, copied or duplicated, or posted to a publicly
accessible website, in whole or in part.
Chapter 7
CFIN4
Thus, the current price of the stock is
P0
ˆ
D
1
ˆ Pˆ
D
$1.00 $1.00 $12.00
2
2
1
2
(1 rs ) (1 rs ) (1.17)1
(1.17)2
$1.00(0.85470) $13.00(0.73051)
$0.8547 $9.4966 $10.35
Cash flow time line:
0
1
2
…
3
rs = 17%
gnorm = 8%
0.8547
9.4966
1.00
1.00
1.08
12.00
ˆ
P
2
13.00
∞
1.00(1.08)∞-2
D̂3
1.08
rs gnorm 0.17 .08
10.3513
7-14
D0 = $0
D̂1 = $0
D̂ 2 = $2.00
Because the $2 dividend actually represents the first constant-growth dividend, the constant growth
model can be used to compute the value of the stock at the end of Year 1 as follows:
P̂1
D̂2
$2.00
$20.00
rs gnorm 0.15 0.05
The PV of $20 one year from today is: PV = P0 = $20/1.15 = $17.39
© 2015 Cengage Learning. All Rights Reserved. May not be scanned, copied or duplicated, or posted to a publicly
accessible website, in whole or in part.
Chapter 7
CFIN4
Cash flow time line:
0
1
2
…
3
rs = 15%
gnorm = 5%
0.00
0.0000
17.3913
2.00
2.10
21.00
Pˆ2
23.00
∞
2.00(1.05)∞-2
D̂3
2.10
rs gnorm 0.15 .05
17.3913
Alternative solution:
D̂ 3 = $2.00(1.05) = $2.10; Because this is affected by constant growth (g norm = 5%), it can be used to
compute the price of the stock at the end of Year 2.
P̂2
D̂3
$2.10
$2.10
$21.00
rs gnorm 0.15 0.05 0.10
Thus, the current price of the stock is
P0
ˆ
D
1
ˆ Pˆ
D
$0
$2.00 $21.00
2
2
1
2
1
(1 rs ) (1 rs ) (1.15)
(1.15)2
$0(0.86957) $23.00(0.75614) $17.39
7-15
D0 = $0
D̂1 = $1.50
D̂ 2 = $2.00
D̂ 3 = $2.00(1.05) = $2.10; Because this is affected by constant growth (g norm = 5%), it can be used to
compute the price of the stock at the end of Year 2.
P̂2
D̂3
$2.10
$2.10
$35
rs gnorm 0.11 0.05 0.06
Thus, the current price of the stock is
P0
ˆ
D
1
(1 rs )
1
ˆ Pˆ
D
2
2
(1 rs )2
$1.50
(1.11)1
$2.00 $35.00
(1.11)2
$1.50(0.90090) $37.00(0.81162) $31.38
© 2015 Cengage Learning. All Rights Reserved. May not be scanned, copied or duplicated, or posted to a publicly
accessible website, in whole or in part.
Chapter 7
CFIN4
Cash flow time line:
0
1
2
…
3
rs = 11%
gnorm = 5%
1.3514
1.50
2.00
2.10
35.00 Pˆ2
30.0300
37.00
∞
2.00(1.05)∞-2
D̂3
2.10
rs gnorm 0.11.05
31.3814
Alternative solution: Because the $2 dividend actually represents the first constant-growth dividend (the
starting basis for constant growth), the constant growth model can be used to compute the value of the
stock at the end of Year 1 as follows:
P̂1
D̂2
$2.00
$33.33
rs gnorm 0.11 0.05
Thus, if the stock is sold in one year, the investor would have received one dividend payment equal to
$1.50 and the $33.33 stock price. The PV of $34.83 one year from today is: PV = P0 = $34.83/1.11 =
$31.38
7-16
D̂1 = $0.60
D̂ 2 = $0.90
D̂ 3 = $2.40
D̂4 = $3.50
D̂ 5 = $3.50(1.04) = $3.64; Because this is affected by constant growth (g norm = 4%), it can be used to
compute the price of the stock at the end of Year 4.
P̂4
D̂5
$3.64
$3.64
$22.75
rs gnorm 0.20 0.04 0.16
Thus, the current price of the stock is
© 2015 Cengage Learning. All Rights Reserved. May not be scanned, copied or duplicated, or posted to a publicly
accessible website, in whole or in part.
Chapter 7
CFIN4
P0
ˆ
ˆ
ˆ Pˆ
D
D
D
3
2
4
4
1
2
3
4
(1 rs ) (1 rs ) (1 rs ) (1 rs )
ˆ
D
1
$0.60
1
(1.20)
$0.90
2
(1.20)
$2.40
3
(1.20)
$3.50 $22.75
(1.20)4
$0.60(0.83333) $0.90(0.69444) $2.40(0.57870) $26.25(0.48225) $15.17
Cash flow time line:
0
1
2
3
4
5
rs = 11%
gnorm = 4%
0.5000
0.6250
1.3889
0.60
0.90
2.40
3.50
…
3.50(1.05)∞-4
3.64
22.75 Pˆ 4
∞
D̂5
3.64
rs gnorm 0.20 .04
26.25
12.6591
15.1730
Alternative solution: Because the $3.50 dividend actually represents the first constant-growth dividend
(the starting basis for constant growth), the constant growth model can be used to compute the value of
the stock at the end of Year 3 as follows:
P̂3
D̂4
$3.50
$21.875
rs gnorm 0.20 0.04
Thus, if the stock is sold in three years, the investor would have received three dividend payments equal
to $0.60, $0.90, and $2.40, respectively, and the $21.875 stock price at the end of Year 3. The PV of
this cash flow stream is:
P0
ˆ
D
1
(1 rs )
1
ˆ
D
2
(1 rs )
2
ˆ Pˆ
D
3
3
(1 rs )
3
$0.60
1
(1.20)
$0.90
2
(1.20)
$2.40 $21.875
(1.20)3
$0.60(0.83333) $0.90(0.69444) $24.275(0.57870) $15.17
7-17
P0 19 x $3.70 = $70.30
7-18
Price range: 28 x $4 = $112 to 30 x 4 = $120
7-19
NI = $65,000
T = 35%
© 2015 Cengage Learning. All Rights Reserved. May not be scanned, copied or duplicated, or posted to a publicly
accessible website, in whole or in part.
Chapter 7
CFIN4
Interest expense = $40,000
Invested capital = $800,000
Cost of funds = 12%
Net income = $65,000 = Taxable income(1 - 0.40)
Taxable income = ($65,000)/(1 - 0.35) = $100,000
EBIT = $100,000 + $40,000 = $140,000
EVA = (EBIT)(1 - T) – (Cost of funds)(Invested capital)
EVA = $140,000(1 – 0.35) – 0.12($800,000) = $91,000 - $96,000 = -$5,000
7-20
Net income = $1.2 million = Taxable income(1 - 0.40)
Taxable income = ($1.2 million)/(1 - 0.40) = $2.0 million
EBIT = Taxable income + Interest
= $2.0 million + $1.5 million
= $3.5 million
EVA = EBIT(1 - T) - (WACC x Invested capital)
= $3.5 million(1 - 0.40) - (0.10 x $8.0 million)
= $2.1 million - $0.8 million
= $1.3 million
© 2015 Cengage Learning. All Rights Reserved. May not be scanned, copied or duplicated, or posted to a publicly
accessible website, in whole or in part.


