Lesson 14: From Ratio Tables, Equations, and Double
advertisement
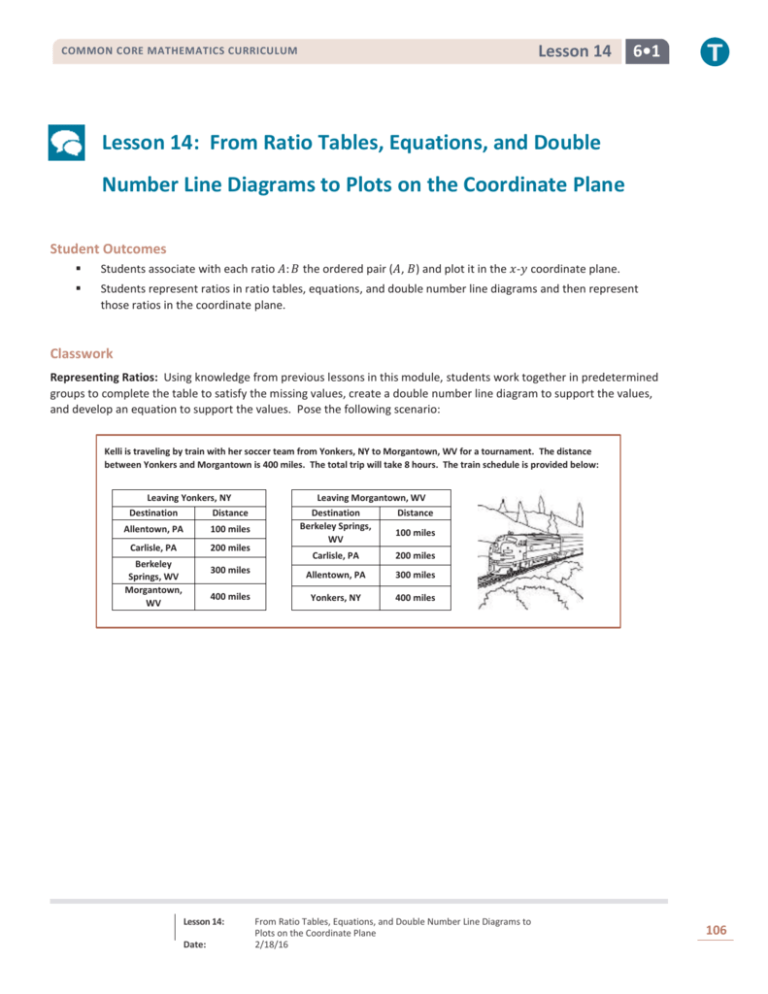
Lesson 14 COMMON CORE MATHEMATICS CURRICULUM 6•1 Lesson 14: From Ratio Tables, Equations, and Double Number Line Diagrams to Plots on the Coordinate Plane Student Outcomes Students associate with each ratio 𝐴: 𝐵 the ordered pair (𝐴, 𝐵) and plot it in the 𝑥-𝑦 coordinate plane. Students represent ratios in ratio tables, equations, and double number line diagrams and then represent those ratios in the coordinate plane. Classwork Representing Ratios: Using knowledge from previous lessons in this module, students work together in predetermined groups to complete the table to satisfy the missing values, create a double number line diagram to support the values, and develop an equation to support the values. Pose the following scenario: Kelli is traveling by train with her soccer team from Yonkers, NY to Morgantown, WV for a tournament. The distance between Yonkers and Morgantown is 400 miles. The total trip will take 8 hours. The train schedule is provided below: Leaving Yonkers, NY Destination Distance Allentown, PA 100 miles Carlisle, PA 200 miles Berkeley Springs, WV Morgantown, WV Distance 100 miles Carlisle, PA 200 miles 300 miles Allentown, PA 300 miles 400 miles Yonkers, NY 400 miles Lesson 14: Date: Leaving Morgantown, WV Destination Berkeley Springs, WV From Ratio Tables, Equations, and Double Number Line Diagrams to Plots on the Coordinate Plane 2/18/16 106 Lesson 14 COMMON CORE MATHEMATICS CURRICULUM 6•1 Exercise 1 (10 minutes) Exercise 1 Create a table to show the time it will take Kelli and her team to travel from Yonkers to each town listed in the schedule assuming that the ratio of the amount of time traveled to the distance traveled is the same for each city. Then, extend the table to include the cumulative time it will take to reach each destination on the ride home. Hours Miles 2 100 4 200 6 300 8 400 10 500 12 600 14 700 16 800 Exercise 2 (5 minutes) Exercise 2 Create a double number line diagram to show the time it will take Kelli and her team to travel from Yonkers to each town listed in the schedule. Then, extend the double number line diagram to include the cumulative time it will take to reach each destination on the ride home. Represent the ratio of the distance traveled on the round trip to the amount of time taken with an equation. hours 0 2 4 6 8 10 12 14 16 0 100 200 300 400 500 600 700 800 miles Using the information from the double number line diagram, how many miles would be traveled in one hour? 50 How do you know? If the train is moving at a constant speed, half of 2 is 1, and half of 100 is 50. Lesson 14: Date: From Ratio Tables, Equations, and Double Number Line Diagrams to Plots on the Coordinate Plane 2/18/16 107 Lesson 14 COMMON CORE MATHEMATICS CURRICULUM 6•1 Example 1 (25 minutes) Example 1 Dinner service starts once the train is 250 miles away from Yonkers. What is the minimum time the team will have to wait before they can have their meal? Time and Distance of Travel Hours Miles Ordered Pairs 2 100 (2, 100) 4 200 (4, 200) 6 300 (6, 300) 8 400 (8, 400) 10 500 (10, 500) 12 600 (12, 600) 14 700 (14, 700) 16 800 (16, 800) Discussion Elicit prior knowledge of the coordinate plane from fifth grade, where students plotted points using order pairs of numbers identified as coordinates, identified 𝑥- and 𝑦-axes, and determined how to travel along the axes based upon the ordered pairs. Display the completed table and coordinate plane below. Should materials be available, students can use sticky dots to aid in plotting points on large gridded chart paper. Have students determine the following through questioning and discussion: We use the horizontal and vertical axes to measure quantities. In most cases, time is what is placed on the horizontal axis. How should we label this axis? Which quantity will we measure using the vertical axis, time or distance? Distance How should we label this axis? Hours, then Label Miles, then Label Let’s create the intervals for the 𝑥-axis. The data is increasing by two each time, but there is enough room to count by 1 for each interval. Lesson 14: Date: From Ratio Tables, Equations, and Double Number Line Diagrams to Plots on the Coordinate Plane 2/18/16 108 COMMON CORE MATHEMATICS CURRICULUM Lesson 14 6•1 Create the intervals on the 𝑥-axis. Now, let’s look at the intervals for the 𝑦-axis. The data is increasing by 100, so we will use 100 as the interval on the 𝑦-axis. Create the intervals on the 𝑦-axis. How can I show the relationship between hours and distance on the coordinate plane? Travel first from the origin using the 𝑥-coordinate (the hours). Next, travel from the 𝑥-coordinate up the 𝑦-axis the value of the 𝑦-coordinate (miles). Guide students through the following activity to ensure students understand that an ordered pair can be graphed on a plane. Students should also understand how far the train traveled during a given time period and how long it took for the train to travel a given distance. Have students locate the ordered pair (4, 600) on the coordinate plane. What does this point represent in the context of distance and time? The train traveled 600 miles in 4 hours. Have students locate the ordered pair (7, 500) on the coordinate plane. How far did the train travel in 7 hours? The train traveled 500 miles in 7 hours. Have students locate the ordered pair (15, 750) on the coordinate plane. How many hours does it take the train to travel 750 miles? The train has traveled 750 miles in 15 hours. Elicit student responses to create and then place the ordered pairs from the table on the coordinate plane. Allow students to individually model placement of ordered pairs on the coordinate plane, coming to the instructional area and explaining in detail the reasoning behind their placement of the point. What do you notice about the arrangement of the points on the coordinate plane? They appear to be in a line. Model how to connect the ordered pairs to the origin with a line and arrow. What do you think having an ordered pair of (0,0) means since we drew the line to the origin? Using this graph, we can determine how many hours the team will have to wait before being served dinner. What information do we know? Zero hours after the trip began the train has traveled zero miles. Dinner is served at mile 250. Where can we find 250 miles on our graph? Students take time to think and share their thoughts with a partner. One pair of students will come to the instructional area and share their thoughts with the class. Model how to draw a horizontal line from 100 miles on the 𝑦-axis to the line representing the relationship between hours and miles. If I draw a vertical line down, at what hour will I intersect the 𝑥-axis? 2 hours Lesson 14: Date: From Ratio Tables, Equations, and Double Number Line Diagrams to Plots on the Coordinate Plane 2/18/16 109 Lesson 14 COMMON CORE MATHEMATICS CURRICULUM What do you notice? It takes 2 hours to travel 100 miles. What would happen if I drew a horizontal line from 200 miles on the 𝑦-axis to the line representing the relationship between hours and miles and then drew a vertical line down to the 𝑥-axis? 6•1 We will intersect the 𝑥-axis at 4 hours. Draw a horizontal line from 250 miles on the 𝑦-axis to the line representing the relationship between hours and miles. Draw a vertical line down to the 𝑥-axis. What do you notice? What is the midpoint of the intervals between 4 hours and 6 hours? 5 hours How many hours will the team have to wait to be served dinner? We intersect the 𝑥-axis halfway between 4 hours and 6 hours. 5 hours Check with the table and the following equation: 𝑀𝑖𝑙𝑒𝑠 = 50 × ℎ𝑜𝑢𝑟𝑠 𝑀𝑖𝑙𝑒𝑠 = 50 × 5 250 = 250 Closing (5 minutes) Why would you choose to use a graph to represent a ratio? Answers will vary but should include consideration that reading a graph can be more efficient than creating a table to determine missing values. Lesson Summary A ratio table, equation, or double number line diagram can be used to create ordered pairs. These ordered pairs can then be graphed on a coordinate plane as a representation of the ratio. Example: Equation: 𝒚 = 𝟑𝒙 𝒙 𝒚 0 0 1 3 2 6 3 9 Ordered Pairs (𝒙, 𝒚) (0, 0) (1, 3) (2, 6) (3, 9) Exit Ticket (5 minutes) Lesson 14: Date: From Ratio Tables, Equations, and Double Number Line Diagrams to Plots on the Coordinate Plane 2/18/16 110 Lesson 14 COMMON CORE MATHEMATICS CURRICULUM Name ___________________________________________________ 6•1 Date____________________ Lesson 14: From Ratio Tables, Equations, and Double Number Line Diagrams to Plots on the Coordinate Plane Exit Ticket Dominic works on the weekends and on vacations from school mowing lawns in his neighborhood. For every lawn he mows, he charges $12. Complete the table. Then determine ordered pairs, and create a labeled graph. Lawns Charge Ordered Pairs 2 4 6 8 10 1. How many lawns will Dominic need to mow in order to make $120? 2. How much money will Dominic make if he mows 9 lawns? Lesson 14: Date: From Ratio Tables, Equations, and Double Number Line Diagrams to Plots on the Coordinate Plane 2/18/16 111 Lesson 14 COMMON CORE MATHEMATICS CURRICULUM 6•1 Exit Ticket Sample Solutions The following solutions indicate an understanding of the objectives of this lesson: Dominic works on the weekends and on vacations from school mowing lawns in his neighborhood. For every lawn he mows, he charges $12. Complete the table. Then determine ordered pairs, and create a labeled graph. Charges for Lawns Cut 1. Lawns Charge Ordered Pairs 2 24 (2, 24) 4 48 (4, 48) 6 72 (6, 72) 8 96 (8, 96) 10 120 (10, 120) How many lawns will Dominic need to mow in order to make $240? 20 lawns 2. How much money will Dominic make if he mowed 9 lawns? $108 Problem Set Sample Solutions 1. Complete the table of values to find the following: Find the number of cups of sugar needed if for each pie Karrie makes, she has to use 3 cups of sugar. Pies 1 2 3 4 5 6 Cups of Sugar in Pies Cups of sugar 3 6 9 12 15 18 Use a graph to represent the relationship: Lesson 14: Date: From Ratio Tables, Equations, and Double Number Line Diagrams to Plots on the Coordinate Plane 2/18/16 112 Lesson 14 COMMON CORE MATHEMATICS CURRICULUM 6•1 Create a double number line diagram to show the relationship: 2. Write a story context that would be represented by the ratio 1:4. Answers will vary. Example: Kendra’s mom pays her four dollars for every load of laundry she washes and dries. Complete a table of values for this equation and graph. Pay for Laundry Loads of Laundry Amount of Money She Earned 1 4 2 8 3 12 4 16 5 20 Lesson 14: Date: From Ratio Tables, Equations, and Double Number Line Diagrams to Plots on the Coordinate Plane 2/18/16 113

