iLearn Day 1 - Barren County Schools
advertisement
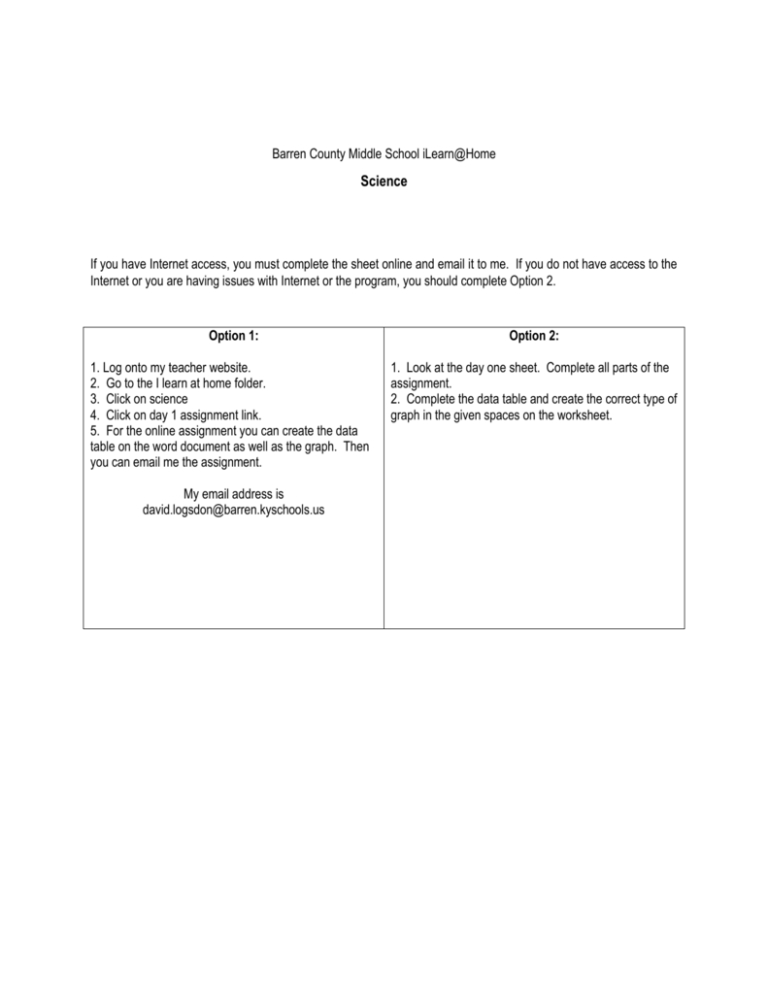
Barren County Middle School iLearn@Home Science If you have Internet access, you must complete the sheet online and email it to me. If you do not have access to the Internet or you are having issues with Internet or the program, you should complete Option 2. Option 1: Option 2: 1. Log onto my teacher website. 2. Go to the I learn at home folder. 3. Click on science 4. Click on day 1 assignment link. 5. For the online assignment you can create the data table on the word document as well as the graph. Then you can email me the assignment. 1. Look at the day one sheet. Complete all parts of the assignment. 2. Complete the data table and create the correct type of graph in the given spaces on the worksheet. My email address is david.logsdon@barren.kyschools.us iLearn@Home: Snow Depth Objective: Students will be able to gather, analyze and graph data. Next Generation Science Standard: SEP: Analyzing and Interpreting Data Task: 1. Using a ruler or tape measure, record the depth of snow (in inches or centimeters) at 10 different locations in the area around your home. 2. Record your observations of the depth of the snow at each location in the data table below. 3. Create a bar graph that displays the data in your data table. The independent variable is the location (x-axis) and the dependent variable is the depth of the snow (in inches or centimeters) (y-axis). 4. Answer the questions that follow the graph below. Depth of Snow at Different Locations Around My Home Location Depth of Snow (in or cm) _____________________ (Title) (DV) _______________ (IV) Data Analysis: 1. What do you notice about the depth of the snow at different locations? 2. Why do you suppose there are differences in the depth at different locations? 3. How long do you think it will take the snow to melt? 4. How much rain do you think this amount of snow would be equal to? 5. Why do you think the snow on the road melts before the snow on the grass?

