Additional File Supplementary Table 1. Top 20 differentially
advertisement
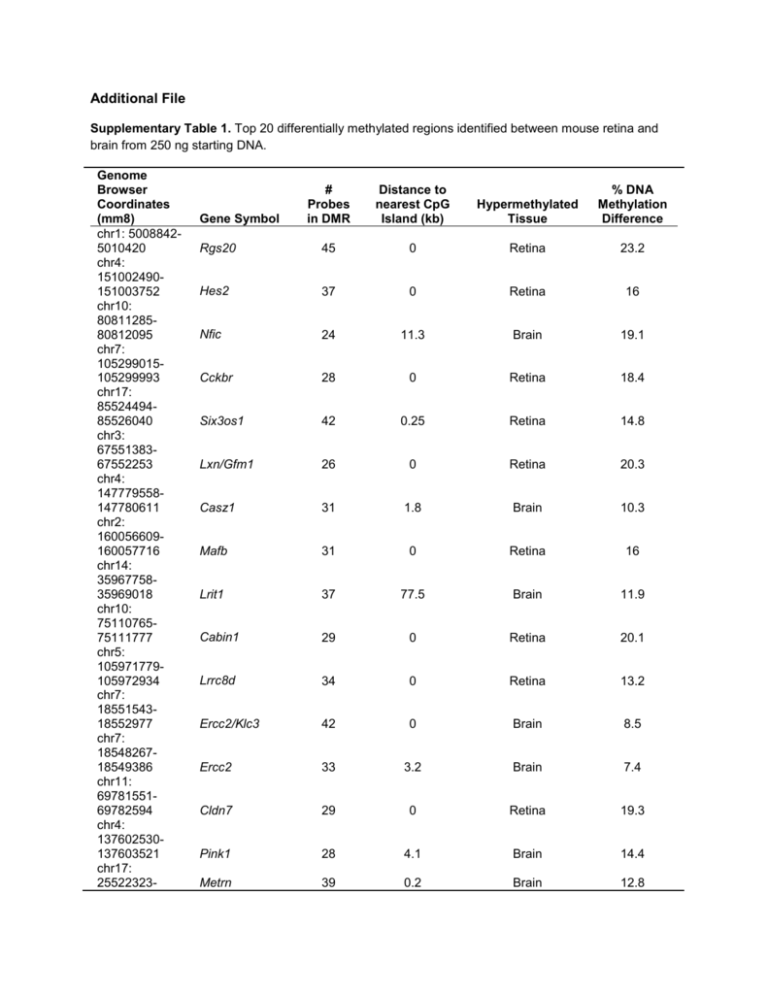
Additional File Supplementary Table 1. Top 20 differentially methylated regions identified between mouse retina and brain from 250 ng starting DNA. Genome Browser Coordinates (mm8) chr1: 50088425010420 chr4: 151002490151003752 chr10: 8081128580812095 chr7: 105299015105299993 chr17: 8552449485526040 chr3: 6755138367552253 chr4: 147779558147780611 chr2: 160056609160057716 chr14: 3596775835969018 chr10: 7511076575111777 chr5: 105971779105972934 chr7: 1855154318552977 chr7: 1854826718549386 chr11: 6978155169782594 chr4: 137602530137603521 chr17: 25522323- # Probes in DMR Distance to nearest CpG Island (kb) Hypermethylated Tissue % DNA Methylation Difference Rgs20 45 0 Retina 23.2 Hes2 37 0 Retina 16 Nfic 24 11.3 Brain 19.1 Cckbr 28 0 Retina 18.4 Six3os1 42 0.25 Retina 14.8 Lxn/Gfm1 26 0 Retina 20.3 Casz1 31 1.8 Brain 10.3 Mafb 31 0 Retina 16 Lrit1 37 77.5 Brain 11.9 Cabin1 29 0 Retina 20.1 Lrrc8d 34 0 Retina 13.2 Ercc2/Klc3 42 0 Brain 8.5 Ercc2 33 3.2 Brain 7.4 Cldn7 29 0 Retina 19.3 Pink1 28 4.1 Brain 14.4 Metrn 39 0.2 Brain 12.8 Gene Symbol 25523682 chr16: 9238719692388249 chr2: 148098604148099585 chr2: 2879175528792907 chr17: 7165435371655565 Clic6 31 0 Retina 15.7 Thbd 29 0 Brain 17.8 1700101E01Rik 34 51.6 Brain 9.2 BC027072 35 31.8 Brain 10.4 Supplementary Table 2. The PCR amplification primers used for pyrosequencing of the top 5 DMRs identified using MeKL-chip. Gene Forward Primer Reverse Primer (5´ Biotinylated) Rgs20 TGGGGTTTTGTGAATGAAGAGAT Hes2 TTGGGGTTTAGAGGAGTAGT ATACACTCCACCCTACCAT TAAACCCCTCACATTAAATACTCC ATA Nfic Cckbr Six3os1 GTGTTTGGAAAGAGTATAGAGTTAG AG GGTATGAGAGGTGGGTAGAAAA GGATGTGGGGGGTGGAAG ACTACTTCCAACCCTATAACACT CCACCAACCTTCCCTTAAAC CCCTACTAAAACCCCACCATT Annealing Temp. (°C) 61 60 61 60 60 Supplementary Table 3. The sequencing primers used for pyrosequencing validation of the top 5 DMRs identified using MeKL-chip. Gene Rgs20 Hes2 Nfic Cckbr Six3os1 Sequencing Primers GAGAGGAGTTGGTGT GTTTTTTTATTTTAAATAGTGGTTT AAGTTGAAAATGAGATGAAT GAGTTTTGATGGTTATATGATA AGATATTTTTAAGAGAAGGAGA TTTGTTTGGAGTGTAGT TTTGGAGTTAAGGAGG AGTTATTTGGTGGGATAAA GGGGTTTATTAGGTAGA Supplementary Figure Legends Supplementary Figure 1. The KLM-PCR protocol. (A) Modification of the universal adapter oligo sequence. The original LM-PCR oligo contained a palindrome at the 3ʹ end [9]. Prevention of dimerization through the disruption of the oligo palindrome increases the amount of available oligo for KLM-PCR amplification. dNTPs are now the limiting factor in the amplification. (B) NanoDrop quantification of the mean µg DNA produced after KLM-PCR. Bars represent the mean of duplicate experiments from amplification of 10, 25, 50 and 250 ng pre-enriched starting DNA, or 10 ng of unenriched (UE) DNA. Error bars show standard deviation (n=2). Supplementary Figure 2. CpG methylation of the 4 other top T-DMRs (black boxes) between retina (red) and brain (blue) using MeKL-chip (top plots) and pyrosequencing validation of the differential methylation (bottom graphs). See Figure 2C for description of MeKL-chip results. Pyrosequencing of CpGs within the T-DMR confirmed differential methylation (p < 0.001, Student’s two-tailed, paired t-test) between the retina (red bars) and brain (blue bars) in a second cohort of mice. Error bars, 95% CI (n=5). Supplementary Figure 3. Pre-hybridization validation of enrichment from low-input (10, 25 and 50 ng) enriched DNA from retina and brain samples. The mixed effects regression model with a random intercept for the measures from triplicate QPCR of 2 PCR amplifications of the same sample were used to calculate the mean difference and standard error in fold enrichment. (a) Post-enrichment, Rbp3 (grey bars) and Rho (black bars) were enriched for methylated DNA in the brain samples for all amounts of starting DNA, whereas no enrichment was observed in unenriched (UE) DNA. (b) Post-KLM-PCR, QPCR showed maintenance of the enrichment pattern for methylation in the brain samples for Rho (black bars) and Rbp3 (grey bars) and no enrichment of the UE samples. Supplementary Figure 4. MeKL-chip CpG site methylation profiling of the Rgs20 region identified as a TDMR (highest ranked, p < 1E-16, black box; lower ranked, p < 0.0091, dashed box) for the 250 ng highinput samples in brain (blue) and retina (red) (top plot) as previously shown in Figure 2. The 10 ng lowinput sample at the same region of Rgs20 is shown for direct comparison (lower plot) in brain (blue) and retina (red). Each point is the relative percentage methylation for 1 probe in 1 sample. The 250 ng plot contains biological triplicates and blue and red lines show the average methylation. The 10 ng plot contains one biological sample. The T-DMRs are still detectable in the 10 ng low-input sample.
