Chapter 8: Populations, Samples, and Probability
Witte & Witte, 9e
Chapter 16
Page 1 of 5 Pages
Chapter 16: Analysis of Variance (One Factor)
Exercise 1
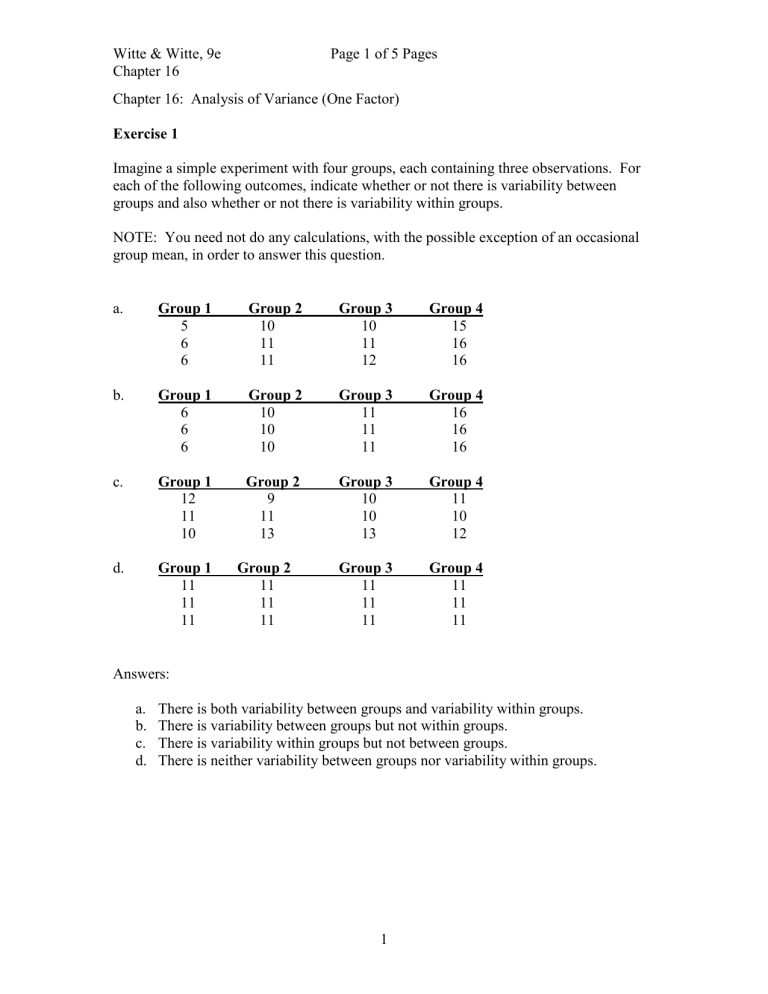
Imagine a simple experiment with four groups, each containing three observations. For each of the following outcomes, indicate whether or not there is variability between groups and also whether or not there is variability within groups.
NOTE: You need not do any calculations, with the possible exception of an occasional group mean, in order to answer this question. a. Group 1
5
6
6 b. Group 1
6
6
6
Group 2
10
11
11
Group 2
10
10
10 c. Group 1 Group 2
12 9
11
10
11
13 d. Group 1 Group 2
11
11
11
11
11 11
Group 3
10
11
12
Group 3
11
11
11
Group 3
10
10
13
Group 3
11
11
11
Group 4
15
16
16
Group 4
16
16
16
Group 4
11
10
12
Group 4
11
11
11
Answers: a.
There is both variability between groups and variability within groups. b.
There is variability between groups but not within groups. c.
There is variability within groups but not between groups. d.
There is neither variability between groups nor variability within groups.
1
Witte & Witte, 9e
Chapter 16
Page 2 of 5 Pages
Exercise 2
Group 1
5
6
6
Group 2
10
11
11
Group 3
10
11
12
Group 4
15
16
16
Carry out a one-way analysis of variance on the data shown above. Follow these steps: a.
Present the null and alternative hypotheses. b.
Calculate df between c.
Calculate df within d.
Identify the critical F value in Table C for a significance level of .01. e.
Present the decision rule. f.
Calculate SS between
. g.
Calculate MS between
. h.
Calculate SS within
. i.
Calculate MS within
. j.
Calculate F. k.
Present the statistical decision.
Answers: a.
H
0
:
1
=
2
=
3
=
4
; H
1
: H
0
is false. b.
df between
= k – 1 = 4 – 1 = 3 c.
df within
= N – k = 12 – 4 = 8 d.
Critical F = 7.59 e.
Reject the null hypothesis if observed F ≥ 7.59 f.
SS between
= 150.25 g.
MS between
= 50.0833 h.
SS within
= 4 i.
MS within
= 0.5 j.
F = 100.1667 k.
Reject the null hypothesis.
Exercise 3
Find the critical values for the following F tests: a.
= .01, df between
= 2, df within
= 50 b.
= .01, df between
= 2, df within
= 200 c.
= .05, df between
= 3, df within
= 70 d.
= .05, df between
= 2, df within
= 32 e.
= .05, df between
= 5, df within
= 42
Answers:
2
Witte & Witte, 9e
Chapter 16
Page 3 of 5 Pages a.
5.06 b.
4.71 c.
2.74 d.
3.30 e.
2.44
Exercise 4
To answer the questions in this exercise, refer to the ANOVA summary table shown below.
ANOVA Summary Table
SOURCE SS df MS F
Between
Within
3.00
52.50
4
35
0.75
1.50
0.50
Total 55.50 39 a.
How many groups of research participants were included in the analysis? b.
What was the total number of research participants across all groups? c.
If the research participants were assigned to groups in equal numbers, how many participants were in each group? d.
Identify the critical F value in Table C for alpha equal to .05. e.
Is the observed F ratio statistically significant?
Answers: a.
5 b.
40 c.
8 d.
2.65 e.
No
3
Witte & Witte, 9e
Chapter 16
Page 4 of 5 Pages
Exercise 5
To answer the questions in this exercise, refer to the partial ANOVA summary table shown below.
SOURCE
Between
Within
SS
23.57 df
3
24
MS
7.86
.95
F
Total 46.43 a.
Calculate SS within
. b.
Calculate df total
. c.
Calculate observed F. d.
How many groups of research participants were included in the analysis? e.
What was the total number of research participants across all groups? f.
If the research participants were assigned to groups in equal numbers, how many participants were in each group? g.
Identify the critical F value in Table C for alpha equal to .05. h.
Is the observed F ratio statistically significant? i.
Calculate the proportion of explain variance using
2
.
Answers: a.
22.86 b.
27 c.
8.27 d.
4 e.
28 f.
7 g.
3.01 h.
Yes i.
.51
4
Witte & Witte, 9e
Chapter 16
Page 5 of 5 Pages
Exercise 6
To answer the questions in this exercise, refer to the summary information given below.
X
1
= 12.29, s = 0.95, n
1
= 7
X
2
= 12.86, s = 0.90, n
2
= 7
X
3
= 13.86, s = 0.81, n
3
= 7
SOURCE
Between
Within
SS
8.86
15.14 df
2
18
MS
4.43
0.84
F
5.27
Total 24.00 20 a.
Using Table G in your textbook, identify q for Tukey’s HSD test with a significance level equal to .05. b.
Calculate HSD for these data. c.
Apply Tukey’s HSD test to these group means and indicate which pairs of means are significantly different. d.
Using formula 16.10 in your textbook, calculate the standardized effect size for each pairwise difference. a.
q = 3.61 b.
HSD = 1.25 c.
X
1
X
2
= .57; not significant
X
1
X
3
= 1.57; significant
X
2
X
3
= 1.00; not significant d.
Group 1 vs. Group 3, d = 1.71
5
