EDUC5504 chapter 9 notes HW
advertisement

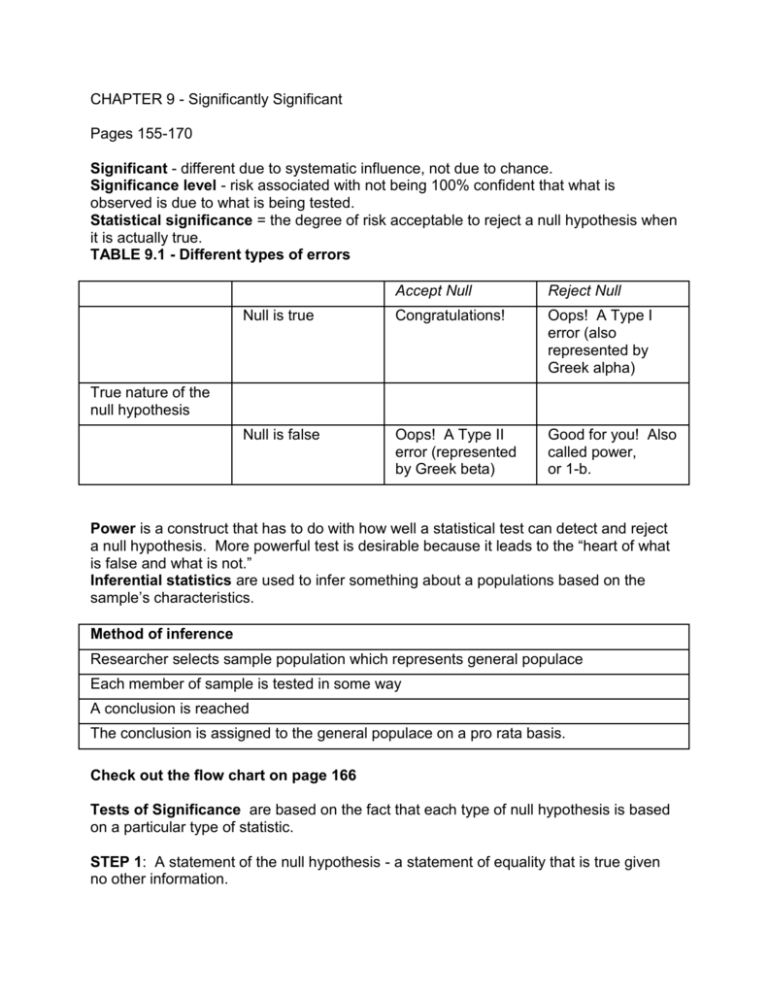
CHAPTER 9 - Significantly Significant Pages 155-170 Significant - different due to systematic influence, not due to chance. Significance level - risk associated with not being 100% confident that what is observed is due to what is being tested. Statistical significance = the degree of risk acceptable to reject a null hypothesis when it is actually true. TABLE 9.1 - Different types of errors Accept Null Reject Null Null is true Congratulations! Oops! A Type I error (also represented by Greek alpha) Null is false Oops! A Type II error (represented by Greek beta) Good for you! Also called power, or 1-b. True nature of the null hypothesis Power is a construct that has to do with how well a statistical test can detect and reject a null hypothesis. More powerful test is desirable because it leads to the “heart of what is false and what is not.” Inferential statistics are used to infer something about a populations based on the sample’s characteristics. Method of inference Researcher selects sample population which represents general populace Each member of sample is tested in some way A conclusion is reached The conclusion is assigned to the general populace on a pro rata basis. Check out the flow chart on page 166 Tests of Significance are based on the fact that each type of null hypothesis is based on a particular type of statistic. STEP 1: A statement of the null hypothesis - a statement of equality that is true given no other information. STEP 2: Setting the level of risk associated with the null hypothesis. The smaller the error is, the less risk is acceptable. STEP 3: Select the appropriate test statistic. STEP 4: Computation of the test statistic value (obtained value) as the result of a specific statistical test. STEP 5: Determine the value needed for rejection of the null hypothesis - remember, there is a critical value at which point the null hypothesis is true. STEP 6: Compare the obtained value to the critical value -- crucial step. STEP 7: If obtained value is more extreme than critical value, the null hypothesis cannot be accepted. STEP 8: It obtained value does not exceed critical value, the null hypothesis is the most attractive explanation. HOMEWORK QUESTIONS C9-Q1-7-P170 1. Why is significance an important construct in the study and use of inferential statistics? The concept of significance is crucial to the study and use of inferential statistics because significance (as reflected in the idea of a significance level) sets the level at which we can be confident that the outcomes we observe are “truthful” and to what extent these outcomes can be generalized to the larger population from which the sample was selected. 2. What does the (idea of the) critical value represent? The critical value represents the minimum value at which the null hypothesis is no longer the accepted explanation for any differences that are observed. 3. What is wrong with the following statements? A. A Type I error of .05 means that 5 times out of 100, I will reject a true null hypothesis. The level of significance refers only to a singular test of the null hypothesis and not to multiple tests. B. It is possible to set the Type I error rate to 0. It is impossible to set the error rate to 0 because it is not possible that we might not reject a null hypothesis when it is actually true. There is ALWAYS that chance. C. The small the Type I error rate, the better the results. The level of risk that is acceptable to reject the null hypothesis when it is true has nothing to do with the meaningfulness of the outcomes. A highly significant outcome may be meaningless, or a relatively high Type I error rate (.10) and have a very meaningful finding. 4. Why is it “harder” to find a significant outcome (all other things being equal) when the research hypothesis is being tested at the .01 rather than the .05 level of significance? At the .01 level, there is less room for error because the test is more rigorous. 5. Here’s more on the significance-meaningfulness debate: A. Provide an example where a finding may be statistically significant and meaningful. A significant difference was found between two groups, with the one that received intensive tutoring far outpacing the self-study group. B. Now, provide an example where a finding may be statistically significant and not meaningful. Examining a huge sample, the researcher determined a very strong positive correlation between ice cream sales and drowning. 6. What does chance have to do with testing the research hypothesis for significance? Chance is reflected in the degree of risk (Type I error) that is acceptable in the possible rejection of a true null hypothesis. 7. In Figure 9.2 (p. 153), there is a striped area on the right side of the illustration. A. What does the entire striped area represent? The striped area represents values that are extreme enough that none of them reflects a finding that supports the null hypothesis. B. If the striped area were a larger portion underneath the curve, what would that represent? A larger number of values would reflect a higher likelihood of a Type I error.


