Table 1: General characteristics of the study subjects (n=41,965
advertisement
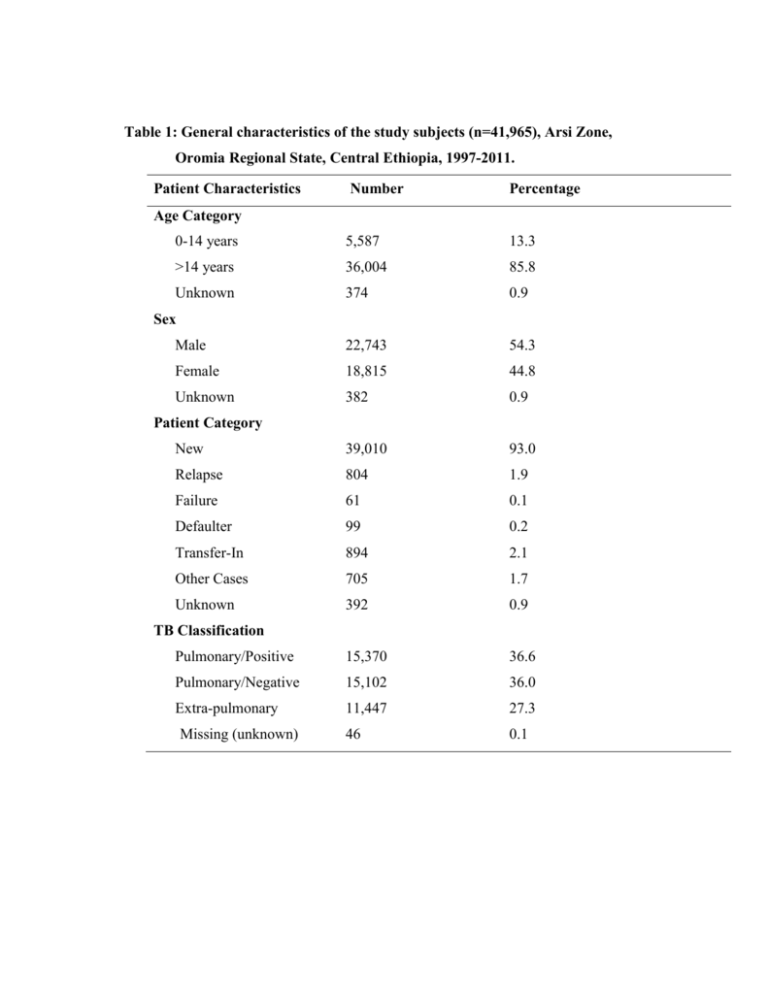
Table 1: General characteristics of the study subjects (n=41,965), Arsi Zone, Oromia Regional State, Central Ethiopia, 1997-2011. Patient Characteristics Number Percentage Age Category 0-14 years 5,587 13.3 >14 years 36,004 85.8 Unknown 374 0.9 Male 22,743 54.3 Female 18,815 44.8 Unknown 382 0.9 New 39,010 93.0 Relapse 804 1.9 Failure 61 0.1 Defaulter 99 0.2 Transfer-In 894 2.1 Other Cases 705 1.7 Unknown 392 0.9 Pulmonary/Positive 15,370 36.6 Pulmonary/Negative 15,102 36.0 Extra-pulmonary 11,447 27.3 46 0.1 Sex Patient Category TB Classification Missing (unknown) Table 2: Yearly average TB case notification/100,000 population and TB /HIV co-infection rate(%), 25 districts in Arsi Zone of Oromia region, Centeral Ethiopia (1997-2011) Average No. of TB Cases TB Case fifteen-year Notified (Avg.) Notification/100,000 TB-HIV co-infection Number HIV positive PTB+ of tested (%) 62.5 10.9 130 9 (6.9%) 11 90.3 16.3 178 18 (9.6%) 49 23 63.2 29.6 304 6 (2%) 62,325 396 102 636.1 163 1415 342 (24.2%) Bele/Ge 68,517 84 18 122.9 25.7 167 6 (3.6%) Cholle 82,728 71 27 85.4 33 282 30 (10.6%) Digalu/Tijo 130,142 207 70 159 53.7 838 62 (7.4%) Diksis 66,987 93 26 138.8 38.1 224 5 (2.2%) Dodota 59,583 187 90 314.2 150.4 444 73 (16.4%) Gololcha 159,521 139 28 86.8 17.5 491 7 (1.4%) Guna 70,752 58 30 81.3 42.2 240 12 (5%) Hetosa 115,089 187 56 162.9 48.4 688 63 (9.2%) Honkolo/Wa 54,257 79 11 145.1 20.2 122 3 (2.5%) Jaju 114,972 155 59 135.2 51.1 788 34 (4.3%) Limu/Bibi 167,414 146 63 87 37.8 429 46 (10.7%) Lode Hitosa 99,259 146 43 146.7 43 433 61 (14.1%) Merti 83,763 143 42 171.1 50.1 595 56 (9.4%) Munessa 154,299 165 23 106.7 14.9 423 42 (9.9%) Robe 153,067 205 68 133.8 44.4 517 30 (5.8%) Shirka 151,782 116 37 76.5 24.6 211 7 (3.3%) Sire 68,533 98 33 142.4 48.1 395 27 (6.8%) Sude 136,904 112 27 82 19.9 293 3 (1%) Tena 61,337 37 10 68.8 16.4 206 14 (6.8%) Z/Dugda 111,979 128 20 87.2 17.9 412 16 (3.9%) Seru 44,406 52.2 11 82.5 40.5 203 12 (5.9%) Name of Mid-Year All All District Population Forms PTB+ve Forms Tiyo 80,384 50 9 Amigna 67,862 61 Aseko 77,930 Assela town Table 3. Factors associated with case notification rate among patients registered from 1997-2011 in Arsi Zone, Oromia Regional State, Central Ethiopia. Variables Residence (N=39,471) Sex (N=41,583) Age (N=41,591) TB Type (41,919) Category Category of Case Notification COR(95% CI) AOR(95% CI) <120 cases/100,000 >120 cases/100,000 Urban 2,554 (17.5) 11,598 (82.5) 1.00 1.00 Rural 9,310 (36.8) 16,009 (63.2) 0.36 (0.35,0.38)** 0.23 (0.21,0.26)** Male 6,876 (30.2) 15,892 (69.8) 1.00 1.00 Female 5,716 (30.4) 13,099 (69.6) 0.99 (0.95,1.03) 0.99 (0.89,1.06) 0-14 years 1,676 (30.0) 3,911 (70.0) 1.00 1.00 15-24 years 4,059 (31.2) 8,942 (68.8) 0.94 (0.88,1.01) 1.19 (1.03,1.38)* 25-49 years 5,387(29.7) 12,729 (70.3) 1.01(0.95,1.08) 1.10 (0.96,1.28) ≥50 years 1,515 (31.0) 3,372 (69.0) 0.95 (0.88,1.04) 1.09 (0.92,1.39) PTB+ 5,226 (34.0) 10,144(66.0) 1.00 1.00 PTB - 3,904 (25.9) 11,198 (74.1) 1.48 (1.41,1.55)** 1.46 (1.33,1.64)** EPTB 3,634 (31.7) 7,813 (68.3) 1.11 (1.05,1.17)** 1.49 (1.33,1.6)** ≤ 25,000 1,112 (16.3) 5,713 (83.7) 1.00 1.00 25,001-40,000 8,280 (43.6) 10,713 (56.4) 0.25 (0.24,0.27)** 0.41 (0.36,0.47)** 3,400 (21.1) 12,747 (78.9) 0.73 (0.68,0.79)** 0.40 (0.35,0.46)** Population ratio to DOTS sites in the districts (N= 41,965) NB: - * Significant at P-value<0.05 and ** Significant at P-value<0.001 With the national standard that one health centre with DOTS service can be accessible for 25,000 in TB care, the ratio of population size to the number of DOTS sites was calculated as total number of population in the district divided by number of DOTS sites in the same district.(Total number of population in the District /Total number DOTS sites in the same district)
