Determination of Iron in Water Lab Report MB
advertisement
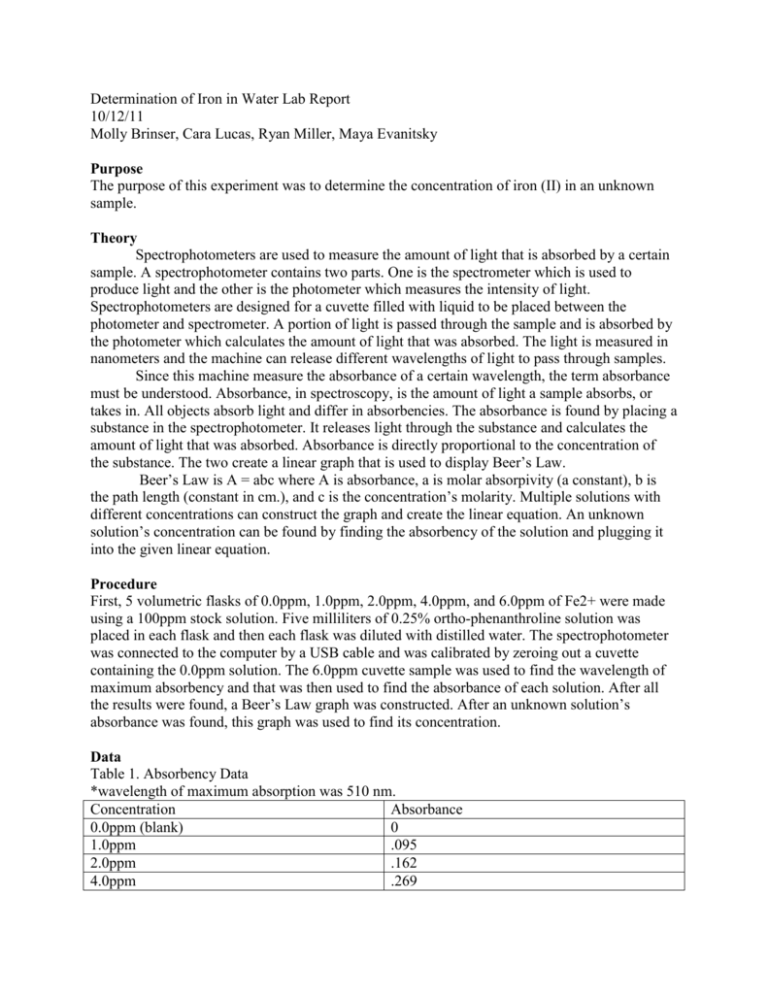
Determination of Iron in Water Lab Report 10/12/11 Molly Brinser, Cara Lucas, Ryan Miller, Maya Evanitsky Purpose The purpose of this experiment was to determine the concentration of iron (II) in an unknown sample. Theory Spectrophotometers are used to measure the amount of light that is absorbed by a certain sample. A spectrophotometer contains two parts. One is the spectrometer which is used to produce light and the other is the photometer which measures the intensity of light. Spectrophotometers are designed for a cuvette filled with liquid to be placed between the photometer and spectrometer. A portion of light is passed through the sample and is absorbed by the photometer which calculates the amount of light that was absorbed. The light is measured in nanometers and the machine can release different wavelengths of light to pass through samples. Since this machine measure the absorbance of a certain wavelength, the term absorbance must be understood. Absorbance, in spectroscopy, is the amount of light a sample absorbs, or takes in. All objects absorb light and differ in absorbencies. The absorbance is found by placing a substance in the spectrophotometer. It releases light through the substance and calculates the amount of light that was absorbed. Absorbance is directly proportional to the concentration of the substance. The two create a linear graph that is used to display Beer’s Law. Beer’s Law is A = abc where A is absorbance, a is molar absorpivity (a constant), b is the path length (constant in cm.), and c is the concentration’s molarity. Multiple solutions with different concentrations can construct the graph and create the linear equation. An unknown solution’s concentration can be found by finding the absorbency of the solution and plugging it into the given linear equation. Procedure First, 5 volumetric flasks of 0.0ppm, 1.0ppm, 2.0ppm, 4.0ppm, and 6.0ppm of Fe2+ were made using a 100ppm stock solution. Five milliliters of 0.25% ortho-phenanthroline solution was placed in each flask and then each flask was diluted with distilled water. The spectrophotometer was connected to the computer by a USB cable and was calibrated by zeroing out a cuvette containing the 0.0ppm solution. The 6.0ppm cuvette sample was used to find the wavelength of maximum absorbency and that was then used to find the absorbance of each solution. After all the results were found, a Beer’s Law graph was constructed. After an unknown solution’s absorbance was found, this graph was used to find its concentration. Data Table 1. Absorbency Data *wavelength of maximum absorption was 510 nm. Concentration Absorbance 0.0ppm (blank) 0 1.0ppm .095 2.0ppm .162 4.0ppm .269 6.0ppm Unknown B .416 .160 Calculations -finding concentration of unknown B in ppm y=mx +b y=A A=mx + b A=.160 m=.06302 b=.03069 .160= (.06302)x + .03069 x= 2.1ppm -finding concentration in terms of molarity 𝑐𝑜𝑛𝑐𝑒𝑛𝑡𝑟𝑎𝑡𝑖𝑜𝑛 𝑖𝑛 𝑚𝑔/𝐿 𝑀 = 𝑚𝑜𝑙𝑒𝑐𝑢𝑙𝑎𝑟 𝑤𝑒𝑖𝑔ℎ𝑡 𝑜𝑓 𝑠𝑜𝑙𝑢𝑡𝑒 𝑥 1,000 1ppm = 1mg/L 2.1ppm=2.1mg/L Fe 2+ amu = 55.85g/mol 2.1𝑚𝑔/𝐿 𝑀 = 55.85𝑔/𝑚𝑜𝑙 𝑥 1,000 M = 3.8 x 10⁻⁵ -finding the percent error |𝑎𝑐𝑡𝑢𝑎𝑙−𝑡ℎ𝑒𝑜𝑟𝑒𝑡𝑖𝑐𝑎𝑙| % 𝑒𝑟𝑟𝑜𝑟 = 𝑋 100 𝑡ℎ𝑒𝑜𝑟𝑒𝑡𝑖𝑐𝑎𝑙 % 𝑒𝑟𝑟𝑜𝑟 = |2.1−2.3| 2.3 𝑋 100 = 8.7 % Error Analysis The percent error for this experiment was 8.7%. An error that occurred in the lab was the when the computer went into sleep mode. Between calibrating the spectrophotometer and preparing the standard iron solutions, a lot of time passed by resulting in the computer going into sleep mode. When trying to get the absorbance values, the computer was not synced one-hundred percent with the spectrophotometer and the Logger-Pro program. This caused a slight error to occur. Conclusion The purpose of this experiment was met because the concentration of the unknown iron (II) solution was discovered. The concentration in ppm was 2.1 and the concentration in terms of molarity was 3.8 x 10⁻⁵. Questions 1. Ortho-phenanthroline was added to the solution to give it an orange color. Iron (II) ions are colorless and when ortho-phenanthroline is added, the 2 create a visible orange color. 2. The purpose of preparing and analyzing standard iron solutions was to get enough information to create an almost perfect Beer’s Law graph. The absorbencies of the standard solution would create a linear graph. The absorbency of the unknown solution would be plugged into the Beer’s Law equation given from the graph to find the concentration of the unknown. 3. Other items that could be analyzed using spectrophotometry are biological samples such as DNA, RNA, and proteins.
