Simple climate model lab Worksheet
advertisement
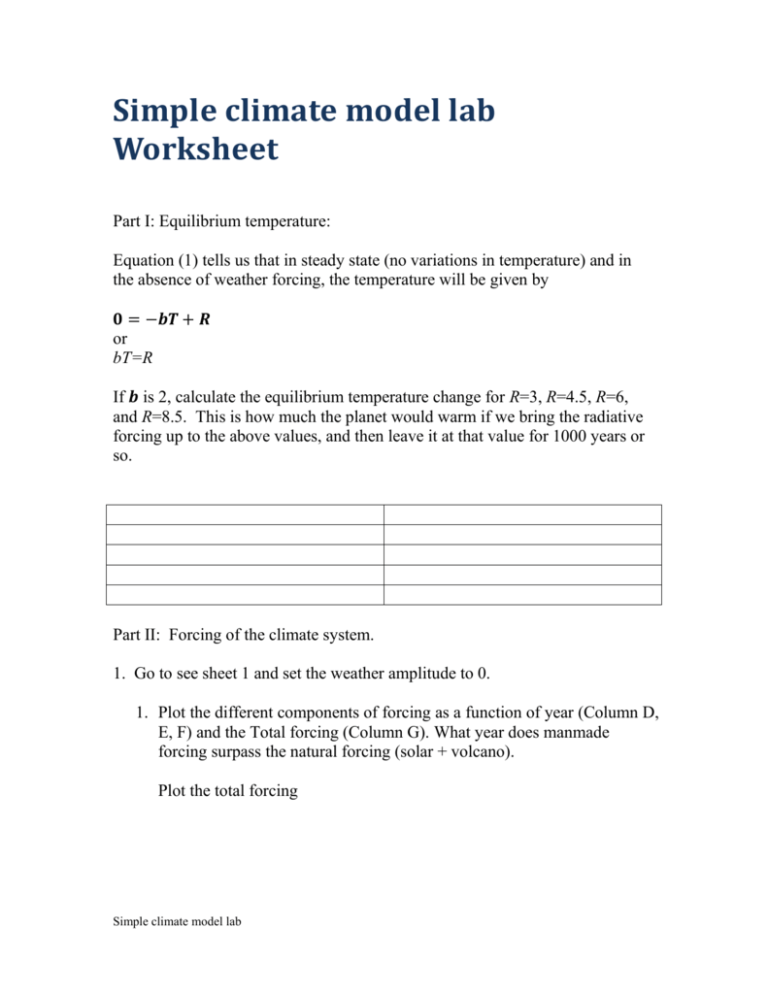
Simple climate model lab Worksheet Part I: Equilibrium temperature: Equation (1) tells us that in steady state (no variations in temperature) and in the absence of weather forcing, the temperature will be given by 𝟎 = −𝒃𝑻 + 𝑹 or bT=R If 𝒃 is 2, calculate the equilibrium temperature change for R=3, R=4.5, R=6, and R=8.5. This is how much the planet would warm if we bring the radiative forcing up to the above values, and then leave it at that value for 1000 years or so. Part II: Forcing of the climate system. 1. Go to see sheet 1 and set the weather amplitude to 0. 1. Plot the different components of forcing as a function of year (Column D, E, F) and the Total forcing (Column G). What year does manmade forcing surpass the natural forcing (solar + volcano). Plot the total forcing Simple climate model lab 2. Make a plot of the carbon dioxide concentration as a function of time (note change the axis to start at 280 ppm). Comment on the relationship between the manmade forcing and the carbon dioxide concentration. 3. Now go to the other sheets RCP3, RCP45, RCP6 and RCP85 and make a plot of the total forcing on the same graph. What are the values at 2100? What are the wiggles in each of the lines? Part I: Controls of surface temperature 1. Go to sheet 1 (1880-2006). Set the weather forcing to 0 and the sensitivity parameter to 2 and the depth of the ocean to 300 m. Save the results in column H in another workbook or sheet (use paste special to paste the values without the formula) Change the sensitivity parameter to 0.5 and save the results in column H Change the sensitivity parameter to 4.0 and save the results in column H Plot the three temperatures on the same plot. How does the surface temperature in 2005 depend on the sensitivity parameter? 2. Set the sensitivity parameter to 2, and change the depth of the upper ocean to 1000 m, and record the surface temperature in 2005. Do the same for depth of the upper ocean to 50m and record the surface temperature. How does the surface temperature depend on the depth of the ocean? Part II: Simulation of 20th century temperature, natural vs. anthropogenic forcing Simple climate model lab 4. Set the sensitivity parameter to 2, the depth of the upper ocean to 300 and the weather forcing to zero. Plot the observed surface temperature (column K) and the temperature from natural (column I) and total forcing (column H) on the same graph. Which curve compares better with the observed temperature. What is missing? 5. Now add weather forcing. Change the weather forcing parameter to 2. Do the curves look more similar? How? 6. Now add weather forcing. Change the weather forcing parameter to 2. Do the curves look more similar? How? Part III; Predicting the surface temperature for the next 300 years. The predicted radiative forcing is given by the amount of anthropogenic greenhouse gases in the atmosphere and how the atmosphere radiates and absorbes that radiation, how cloud react to warming and other feedbacks in the climate system. We are taking the radiative forcing from the web site http://www.pik-potsdam.de/~mmalte/rcps/. 1. Vary the weather parameter and the sensitivity parameter to get the best representation of the 20th century as you can. Use the 300 for the depth of the upper ocean. Plot your best simulation for globally averaged temperature for total forcing and for natural forcing only. Compare against the plot found at http://www.ipcc.ch/publications_and_data/ar4/wg1/en/figure-ts-23.html 2. Using the weather parameter and the sensitivity parameter that you chose for the 20th century, predict the temperature for the next 100 years. Plot your predictions for each of the “scenarios” in sheets 2-5. Compare against the 2007 projections at 2100 http://www.ipcc.ch/publications_and_data/ar4/wg1/en/figure-spm-5.html 3. Next determine how close to equilibrium the climate system is. Set the weather noise to 0 and use the value for b that you chose for 1 above. Record the temperature for each of the cases listed in the Table below then answer the following questions: Simple climate model lab How far out of equilibrium (in degrees C) is the climate system out of equilibrium in 2005? How far will it be out of equilibrium in 2100? Value of b Date Transient total forcing Equilibrium total forcing RCP3 Transient RCP3 Equilibrium RCP 45 Transient RCP 6 Transient RCP 6 Equilbrium RCP 6 Transient RCP 8.5 Equilibrium RCP 8.5 Transient 2005 Simple climate model lab 2005 2100 2100 2100 2100 2100 2100 2100 2100 Radiative forcing Parameter Temperature
