Step 4: ROI extraction from FA images
advertisement
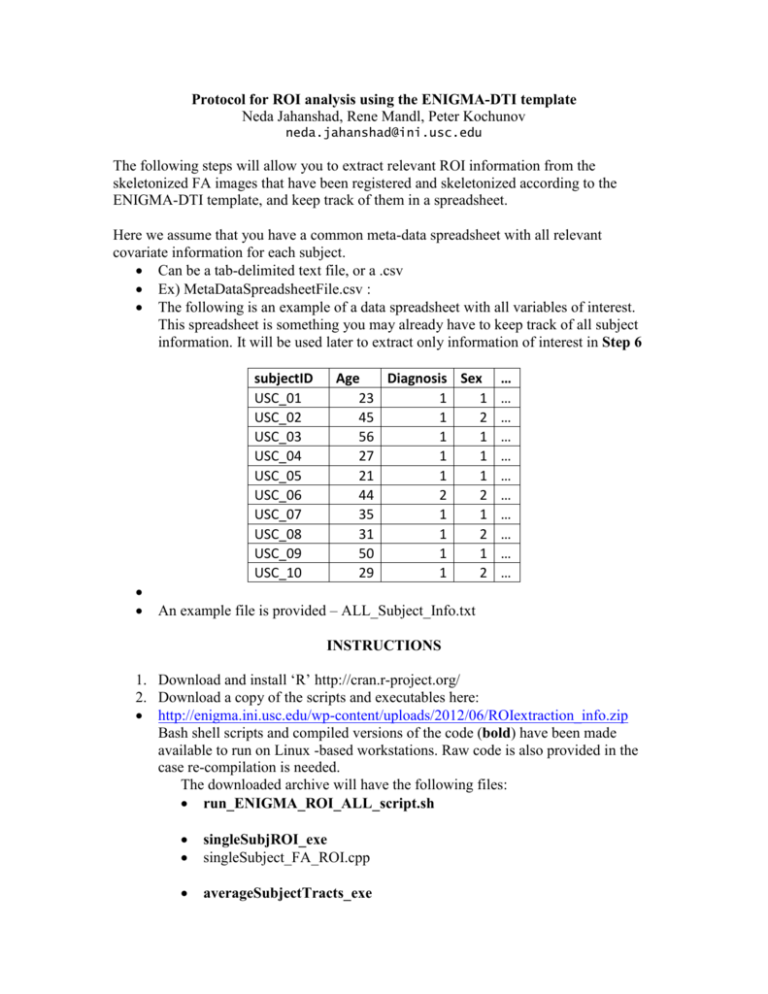
Protocol for ROI analysis using the ENIGMA-DTI template Neda Jahanshad, Rene Mandl, Peter Kochunov neda.jahanshad@ini.usc.edu The following steps will allow you to extract relevant ROI information from the skeletonized FA images that have been registered and skeletonized according to the ENIGMA-DTI template, and keep track of them in a spreadsheet. Here we assume that you have a common meta-data spreadsheet with all relevant covariate information for each subject. Can be a tab-delimited text file, or a .csv Ex) MetaDataSpreadsheetFile.csv : The following is an example of a data spreadsheet with all variables of interest. This spreadsheet is something you may already have to keep track of all subject information. It will be used later to extract only information of interest in Step 6 subjectID USC_01 USC_02 USC_03 USC_04 USC_05 USC_06 USC_07 USC_08 USC_09 USC_10 Age Diagnosis Sex 23 1 1 45 1 2 56 1 1 27 1 1 21 1 1 44 2 2 35 1 1 31 1 2 50 1 1 29 1 2 … … … … … … … … … … … An example file is provided – ALL_Subject_Info.txt INSTRUCTIONS 1. Download and install ‘R’ http://cran.r-project.org/ 2. Download a copy of the scripts and executables here: http://enigma.ini.usc.edu/wp-content/uploads/2012/06/ROIextraction_info.zip Bash shell scripts and compiled versions of the code (bold) have been made available to run on Linux -based workstations. Raw code is also provided in the case re-compilation is needed. The downloaded archive will have the following files: run_ENIGMA_ROI_ALL_script.sh singleSubjROI_exe singleSubject_FA_ROI.cpp averageSubjectTracts_exe average_subj_tract_info.cpp run_combineSubjectROI_script.sh combine_subject_tables.R necessary files -ENIGMA_look_up_table.txt JHU-WhiteMatter-labels-1mm.nii.gz mean_FA_skeleton.nii.gz example files -ALL_Subject_Info.txt subjectList.csv Subject1_FAskel.nii.gz Subject7_FAskel.nii.gz example outputs -Subject1_ROIout.csv Subject1_ROIout_avgs.csv Subject7_ROIout.csv Subject7_ROIout_avgs.csv combinedROItable.csv 3. run_ENIGMA_ROI_ALL_script.sh provides an example shell script on how to run all the pieces in series. This can be modified to run the first two portions in parallel if desired. 4. The first command - singleSubjROI_exe uses the atlas and skeleton to extract ROI values from the JHU-atlas ROIs as well as an average FA value across the entire skeleton It is run with the following inputs ./singleSubjROI_exe look_up_table.txt skeleton.nii.gz JHU-WhiteMatterlabels-1mm.nii.gz OutputfileName Subject_FA_skel.nii.gz example -- ./singleSubjROI_exe ENIGMA_look_up_table.txt mean_FA_skeleton.nii.gz JHU-WhiteMatter-labels-1mm.nii.gz Subject1_ROIout Subject1_FAskel.nii.gz The output will be a .csv file called Subject1_ROIout.csv with all mean FA values of ROIs listed in the first column and the number of voxels each ROI contains in the second column (see ENIGMA_ROI_part1/Subject1_ROIout.csv for example output) 5. The second command - averageSubjectTracts_exe uses the information from the first output to average relevant (example average of L and R external capsule) regions to get an average value weighted by volumes of the regions. It is run with the following inputs ./averageSubjectTracts_exe inSubjectROIfile.csv outSubjectROIfile_avg.csv where the first input is the ROI file obtained from Step 4 and the second input is the name of the desired output file. The output will be a .csv file called outSubjectROIfile_avg.csv with all mean FA values of the new ROIs listed in the first column and the number of voxels each ROI contains in the second column (see ENIGMA_ROI_part2/Subject1_ROIout_avg.csv for example output) 6. The final portion of this analysis is an ‘R’ script combine_subject_tables.R that takes into account all ROI files and creates a spreadsheet which can be used for GWAS or other association tests. It matches desired subjects to a meta-data spreadsheet, adds in desired covariates, and combines any or all desired ROIs from the individual subject files into individual columns. Input arguments as shown in the bash script are as follows: o Table=./ALL_Subject_Info.txt – A meta-data spreadsheet file with all subject information and any and all covariates o subjectIDcol=subjectID the header of the column in the meta-data spreadsheet referring to the subject IDs so that they can be matched up accordingly with the ROI files o subjectList=./subjectList.csv a two column list of subjects and ROI file paths. this can be created automatically when creating the average ROI .csv files – see run_ENIGMA_ROI_ALL_script.sh on how that can be done o outTable=./combinedROItable.csv the filename of the desired output file containing all covariates and ROIs of interest o Ncov=2 The number of covariates to be included from the meta-data spreadsheet At least age and sex are recommended o covariates="Age;Sex" the column headers of the covariates of interest these should be separated by a semi-colon ‘;’ and no spaces o Nroi="all" #2 The number of ROIs to include Can specify “all” in which case all ROIs in the file will be added to the spreadsheet Or can specify only a certain number, for example 2 and write out the 2 ROIs of interest in the next input o rois= “all” #"IC;EC" the ROIs to be included from the individual subject files this can be “all” if the above input is “all” or if only a select number (ex, 2) ROIs are desired, then the names of the specific ROIs as listed in the first column of the ROI file these ROI names should be separated by a semi-colon ‘;’ and no spaces for example if Nroi=2, rois="IC;EC" to get only information for the internal and external capsules into the output .csv file (see combinedROItable.csv for example output) Congrats! Now you should have all of your subjects ROIs in one spreadsheet with only relevant covariates ready for association testing!
![[#DTC-130] Investigate db table structure for representing csv file](http://s3.studylib.net/store/data/005888493_1-028a0f5ab0a9cdc97bc7565960eacb0e-300x300.png)
