file - BioMed Central
advertisement
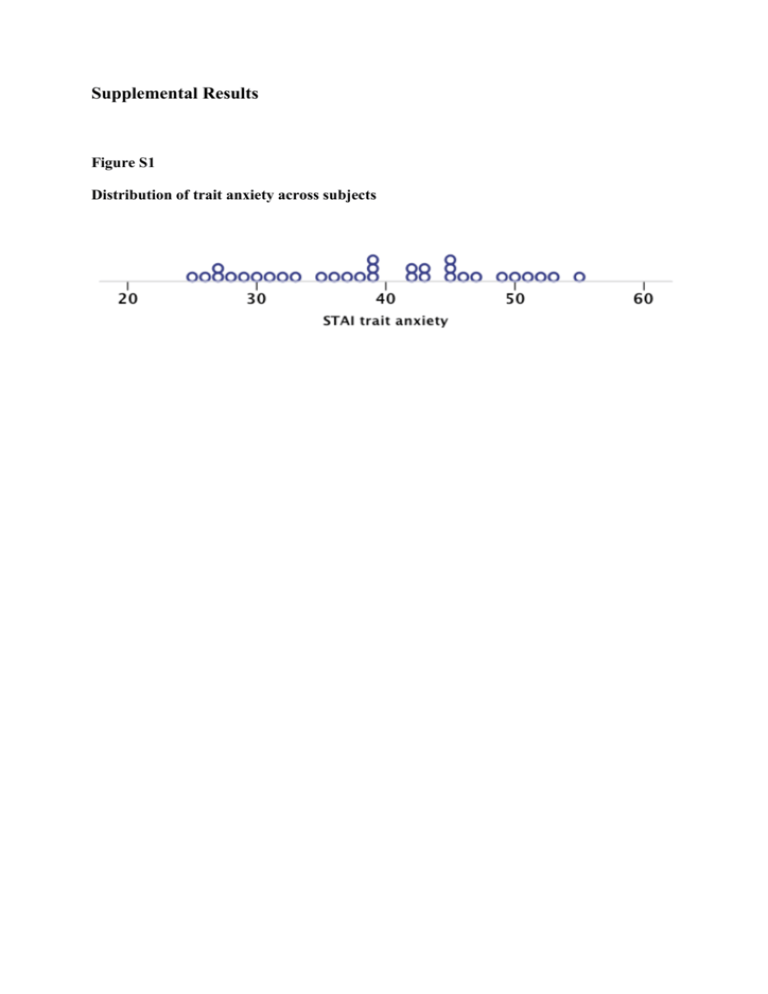
Supplemental Results Figure S1 Distribution of trait anxiety across subjects Figure S2 Scatter plots for associations between trait anxiety and WM/GM volumes of interest Table S1 Associations of mean fractional anisotropy across the uncinate fasciculus with trait anxiety and amygdala volume mean FA left uncinate fasciculus right uncinate fasciculus a absolute relative 0.422 SD = 0.021 0.422 SD = 0.017 0.884 SD = 0.039 0.882 SD = 0.033 correlation a with amygdala trait anxiety volume -0.32 -0.30 b (0.090) (0.111) -0.15 0.06 c (0.446) (0.770) using partial correlations of relative mean FA (tract mean FA divided by global mean FA) with age, sex and depression as covariates of no interest, shown are r-values (p-values in brackets) b correlation with left amygdala volume c correlation with right amygdala volume FA: fractional anisotropy, SD: standard deviation Note: For the uncinate fasciculus, volume and mean FA were positively correlated (left hemisphere: r = 0.44, p < 0.05; right hemisphere: r = 0.51, p < 0.01). These correlations were assessed using respective relative values (controlling for global effects) with age and sex as covariates of no interest. Table S2 Associations of uncinate fasciculus, amygdala and hippocampus volume with depression, anxiety sensitivity, behavioral inhibition, and neuroticism a) using partial correlations with age and sex as covariates of no interest, shown are r-values (p-values in brackets) left uncinate fasciculus left amygdala left hippocampus -0.02 (0.927) 0.16 (0.412) 0.07 (0.711) anxiety sensitivity 0.21 (0.277) -0.10 (0.612) -0.04 (0.825) right uncinate fasciculus right amygdala right hippocampus -0.06 (0.734) 0.01 (0.961) -0.06 (0.764) 0.03 (0.884) -0.11 (0.546) -0.18 (0.344) depression behavioral inhibition -0.21 (0.275) 0.16 (0.387) 0.05 (0.782) -0.14 (0.474) 0.08 (0.663) 0.07 (0.713) 0.09 (0.649) 0.11 (0.573) 0.15 (0.439) -0.05 (0.810) -0.04 (0.836) 0.02 (0.899) neuroticism Note: To make these partial correlations more comparable to those applied in the main manuscript, we also assessed respective correlations with anxiety sensitivity, behavioral inhibition and neuroticism using depression as additional covariate of no interest. Notably, there was no meaningful change for any of the correlations (i.e., direction of effect was preserved with no significant or marginally significant r-value). b) using partial correlations with age, sex and trait anxiety as covariates of no interest, shown are r-values (p-values in brackets) left uncinate fasciculus left amygdala left hippocampus 0.21 (0.272) -0.11 (0.577) -0.16 (0.420) anxiety sensitivity 0.33 (0.082) -0.25 (0.191) -0.16 (0.421) right uncinate fasciculus right amygdala right hippocampus 0.04 (0.846) -0.17 (0.388) -0.33 (0.083) 0.08 (0.672) -0.20 (0.293) -0.31 (0.104) depression behavioral inhibition -0.02 (0.901) -0.12 (0.534) -0.20 (0.294) 0.11 (0.564) -0.30 (0.109) -0.23 (0.228) 0.25 (0.195) -0.05 (0.787) -0.07 (0.699) 0.10 (0.619) -0.30 (0.114) -0.30 (0.109) neuroticism Table S3 Associations between the remaining grey matter volumes and trait anxiety hemisphere structure left thalamus putamen pallidum nucleus accumbens association with trait anxiety a 0.36 (0.058) 0.19 (0.336) 0.16 (0.408) 0.20 (0.300) right thalamus putamen pallidum nucleus accumbens 0.20 (0.296) 0.15 (0.440) 0.15 (0.427) 0.21 (0.282) a using partial correlations with age, sex, and depression as covariates of no interest, shown are r-values (p-values in brackets, significant results indicated in bold, marginally significant results indicated in italics). b one-tailed Table S4 Absolute and relative volumes of all examined white matter and grey matter structures (mean with standard deviation in brackets) left right brain tissue structure absolute b relative c absolute b relative c white matter UF IFOF 3.74 (1.58) 8.16 (2.81) 3.44 (1.27) 7.64 (2.60) 3.87 (0.98) 7.82 (2.65) 3.58 (0.76) 7.25 (2.36) grey matter AMYG HIPP THAL CAUD PUTA PALL NACC 1.75 (0.25) 4.36 (0.44) 7.28 (0.62) 3.95 (0.51) 6.37 (0.68) 1.81 (0.21) 0.73 (0.11) 1.64 (0.21) 4.07 (0.38) 6.80 (0.57) 3.68 (0.47) 5.95 (0.63) 1.69 (0.18) 0.69 (0.11) 1.86 (0.24) 4.43 (0.49) 7.11 (0.51) 4.02 (0.51) 6.02 (0.59) 1.69 (0.19) 0.78 (0.11) 1.74 (0.23) 4.14 (0.46) 6.65 (0.56) 3.75 (0.42) 5.63 (0.62) 1.58 (0.17) 0.73 (0.10) b in ml c in ml (divided by intracranial volume, subsequently multiplied by 1000) UF: uncinate fasciculus, IFOF: inferior fronto-occipital fasciculus, AMYG: amygdala, HIPP: hippocampus, THAL: thalamus, CAUD: caudate nucleus, PUTA: putamen, PALL: pallidum, NACC: nucleus accumbens
