Appendix Table S1. File Format: XLS Title: Target region selection
advertisement
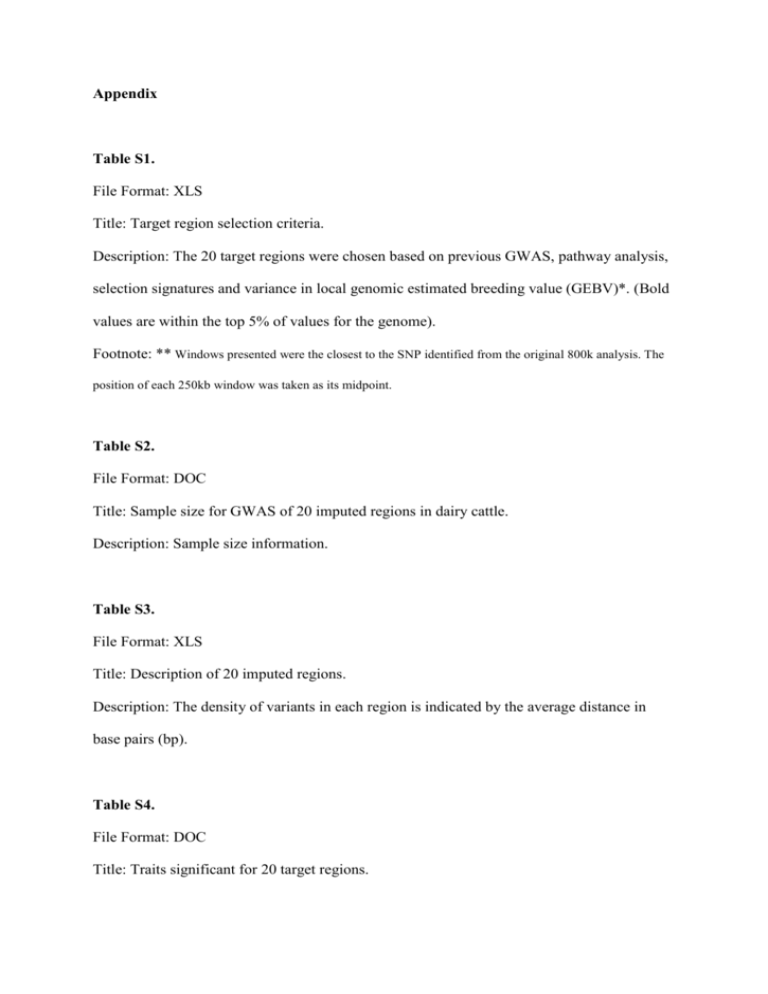
Appendix Table S1. File Format: XLS Title: Target region selection criteria. Description: The 20 target regions were chosen based on previous GWAS, pathway analysis, selection signatures and variance in local genomic estimated breeding value (GEBV)*. (Bold values are within the top 5% of values for the genome). Footnote: ** Windows presented were the closest to the SNP identified from the original 800k analysis. The position of each 250kb window was taken as its midpoint. Table S2. File Format: DOC Title: Sample size for GWAS of 20 imputed regions in dairy cattle. Description: Sample size information. Table S3. File Format: XLS Title: Description of 20 imputed regions. Description: The density of variants in each region is indicated by the average distance in base pairs (bp). Table S4. File Format: DOC Title: Traits significant for 20 target regions. Description: X denotes the traits for which the closest gene to the most significant variant in the target region contained one or more significant variant (P<10-8). The target trait is the experimental trait for this study (most significant trait for the QTL in the original GWAS). An X* represents a calving interval gene with SNP significant at P<10-5. Table S5. File Format: XLS Title: Description of abbreviated genes. Description: List of abbreviated genes used in this study including NCBI gene identifications and descriptions. Table S6. File Format: XLS Title: Statistical support for genes within defined confidence intervals for each target region. Description: P-values were created from multibreed association analyses, DE was assessed using a t-test comparing mammary gland to 15 other tissues (see methods) and the ratio of significant variants within the gene is presented.


![Biology Chapter 3 Study Guide Heredity [12/10/2015]](http://s3.studylib.net/store/data/006638861_1-0d9e410b8030ad1b7ef4ddd4e479e8f1-300x300.png)