Level 9 (docx
advertisement
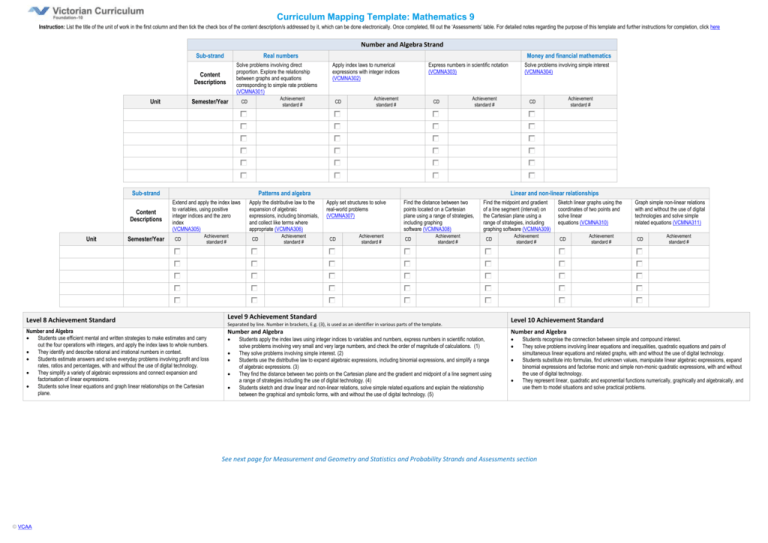
Curriculum Mapping Template: Mathematics 9 Instruction: List the title of the unit of work in the first column and then tick the check box of the content description/s addressed by it, which can be done electronically. Once completed, fill out the ‘Assessments’ table. For detailed notes regarding the purpose of this template and further instructions for completion, click here Number and Algebra Strand Sub-strand Real numbers Solve problems involving direct proportion. Explore the relationship between graphs and equations corresponding to simple rate problems (VCMNA301) Content Descriptions Unit Semester/Year Achievement standard # CD Money and financial mathematics Apply index laws to numerical expressions with integer indices (VCMNA302) Semester/Year Patterns and algebra Achievement standard # CD Apply the distributive law to the expansion of algebraic expressions, including binomials, and collect like terms where appropriate (VCMNA306) Achievement standard # CD Linear and non-linear relationships Apply set structures to solve real-world problems (VCMNA307) Achievement standard # CD Achievement standard # CD Extend and apply the index laws to variables, using positive integer indices and the zero index (VCMNA305) Solve problems involving simple interest (VCMNA304) Achievement standard # CD Sub-strand Unit Achievement standard # CD Content Descriptions Express numbers in scientific notation (VCMNA303) Find the distance between two points located on a Cartesian plane using a range of strategies, including graphing software (VCMNA308) Achievement standard # CD Find the midpoint and gradient of a line segment (interval) on the Cartesian plane using a range of strategies, including graphing software (VCMNA309) Achievement standard # CD Achievement standard # CD Graph simple non-linear relations with and without the use of digital technologies and solve simple related equations (VCMNA311) Achievement standard # CD Level 8 Achievement Standard Number and Algebra Students use efficient mental and written strategies to make estimates and carry out the four operations with integers, and apply the index laws to whole numbers. They identify and describe rational and irrational numbers in context. Students estimate answers and solve everyday problems involving profit and loss rates, ratios and percentages, with and without the use of digital technology. They simplify a variety of algebraic expressions and connect expansion and factorisation of linear expressions. Students solve linear equations and graph linear relationships on the Cartesian plane. Level 9 Achievement Standard Separated by line. Number in brackets, E.g. (3), is used as an identifier in various parts of the template. Level 10 Achievement Standard Number and Algebra Number and Algebra Students apply the index laws using integer indices to variables and numbers, express numbers in scientific notation, solve problems involving very small and very large numbers, and check the order of magnitude of calculations. (1) They solve problems involving simple interest. (2) Students use the distributive law to expand algebraic expressions, including binomial expressions, and simplify a range of algebraic expressions. (3) They find the distance between two points on the Cartesian plane and the gradient and midpoint of a line segment using a range of strategies including the use of digital technology. (4) Students sketch and draw linear and non-linear relations, solve simple related equations and explain the relationship between the graphical and symbolic forms, with and without the use of digital technology. (5) Students recognise the connection between simple and compound interest. They solve problems involving linear equations and inequalities, quadratic equations and pairs of simultaneous linear equations and related graphs, with and without the use of digital technology. Students substitute into formulas, find unknown values, manipulate linear algebraic expressions, expand binomial expressions and factorise monic and simple non-monic quadratic expressions, with and without the use of digital technology. They represent linear, quadratic and exponential functions numerically, graphically and algebraically, and use them to model situations and solve practical problems. See next page for Measurement and Geometry and Statistics and Probability Strands and Assessments section © VCAA Sketch linear graphs using the coordinates of two points and solve linear equations (VCMNA310) Curriculum Mapping Template: Mathematics 9 Measurement and Geometry Strand Sub-strand Content Descriptions Unit Semester/Year Using units of measurement Calculate the areas of composite shapes (VCMMG312) Achievement standard # CD Calculate the surface area and volume of cylinders and solve related problems (VCMMG313) Achievement standard # CD Investigate very small and very large time scales and intervals (VCMMG315) Achievement standard # CD Geometric reasoning Solve problems involving the surface area and volume of right prisms (VCMMG314) Achievement standard # CD Use the enlargement transformation to explain similarity and develop the conditions for triangles to be similar (VCMMG316) Achievement standard # CD Pythagoras and trigonometry Solve problems using ratio and scale factors in similar figures (VCMMG317) Achievement standard # CD Investigate Pythagoras’ Theorem and its application to solving simple problems involving right angled triangles (VCMMG318) Achievement standard # CD Use similarity to investigate the constancy of the sine, cosine and tangent ratios for a given angle in right-angled triangles (VCMMG319) Achievement standard # CD Apply trigonometry to solve right-angled triangle problems (VCMMG320) Achievement standard # CD Statistics and Probability Strand Sub-strand Content Descriptions Unit Semester/Year Chance List all outcomes for two-step chance experiments, both with and without replacement using tree diagrams or arrays. Assign probabilities to outcomes and determine probabilities for events (VCMSP321) Achievement standard # CD Data representation and interpretation Calculate relative frequencies from given or collected data to estimate probabilities of events involving 'and' or 'or' (VCMSP322) Achievement standard # CD Investigate reports of surveys in digital media and elsewhere for information on how data were obtained to estimate population means and medians(VCMSP323) Achievement standard # CD Identify everyday questions and issues involving at least one numerical and at least one categorical variable, and collect data directly from secondary sources (VCMSP324) Achievement standard # CD Construct back-to-back stem-and-leaf plots and histograms and describe data, using terms including ‘skewed’, ‘symmetric’ and ‘bi modal’ (VCMSP325) Achievement standard # CD Compare data displays using mean, median and range to describe and interpret numerical data sets in terms of location (centre) and spread (VCMSP326) Achievement standard # CD Level 9 Achievement Standard Level 8 Achievement Standard Level 10 Achievement Standard Separated by line. Number in brackets, E.g. (3), is used as an identifier in various parts of the template. Measurement and Geometry Students convert between units of measurement for area and for volume. They find the perimeter and area of parallelograms, rhombuses and kites. Students name the features of circles, calculate circumference and area, and solve problems relating to the volume of prisms. They make sense of time duration in real applications, including the use of 24-hour time. Students identify conditions for the congruence of triangles and deduce the properties of quadrilaterals. They use tools, including digital technology, to construct congruent shapes. Statistics and Probability Students explain issues related to the collection of sample data and discuss the effect of outliers on means and medians of the data. They use various approaches, including the use of digital technology, to generate simple random samples from a population. Students model situations with Venn diagrams and two-way tables and explain the use of 'not', 'and' and 'or'. Students choose appropriate language to describe events and experiments. They determine complementary events and calculate the sum of probabilities. Measurement and Geometry Measurement and Geometry Students solve measurement problems involving perimeter and area of composite shapes, surface area and volume of rectangular prisms and cylinders, with and without the use of digital technology. (6) They relate three-dimensional objects to two-dimensional representations. (7) Students explain similarity of triangles, interpret ratios and scale factors in similar figures, and apply Pythagoras's theorem and trigonometry to solve problems involving angles and lengths in right-angled triangles.(8) Statistics and Probability Students compare techniques for collecting data from primary and secondary sources, and identify questions and issues involving different data types. (9) They construct histograms and back-to-back stem-and-leaf plots with and without the use of digital technology. (10) Students identify mean and median in skewed, symmetric and bi-modal displays and use these to describe and interpret the distribution of the data. (11) They calculate relative frequencies to estimate probabilities. (12) Students list outcomes for two-step experiments and assign probabilities for those outcomes and related events. (13) Students solve and explain surface area and volume problems relating to composite solids. They use parallel and perpendicular lines, angle and triangle properties, similarity, trigonometry and congruence to solve practical problems and develop proofs involving lengths, angles and areas in plane shapes. They use digital technology to construct and manipulate geometric shapes and objects, and explore symmetry and pattern in two dimensions. Statistics and Probability Students compare univariate data sets by referring to summary statistics and the shape of their displays. They describe bivariate data where the independent variable is time and use scatter-plots generated by digital technology to investigate relationships between two continuous variables. Students evaluate the use of statistics in the media. They list outcomes for multi-step chance experiments involving independent and dependent events, and assign probabilities for these experiments. Assessments Unit (Title) © VCAA Assessment Achievement Standard/s Unit (Title) Page 2 Assessment Achievement Standard/s

