How much should a nation spend on science? What kind of science
advertisement
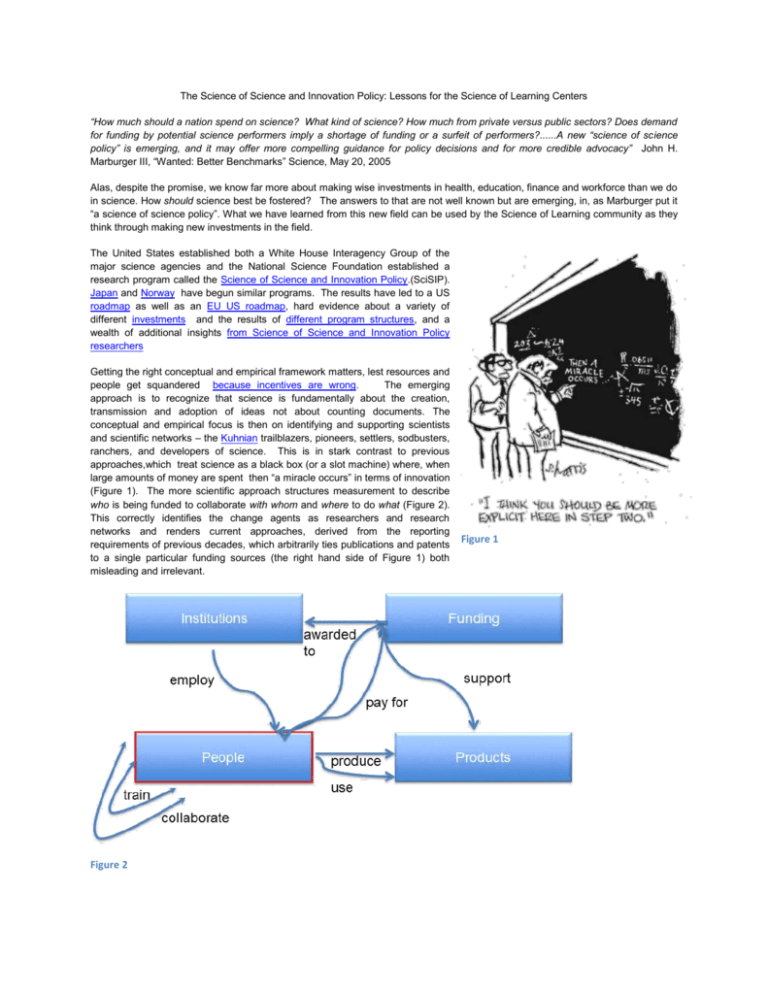
The Science of Science and Innovation Policy: Lessons for the Science of Learning Centers “How much should a nation spend on science? What kind of science? How much from private versus public sectors? Does demand for funding by potential science performers imply a shortage of funding or a surfeit of performers?......A new “science of science policy” is emerging, and it may offer more compelling guidance for policy decisions and for more credible advocacy” John H. Marburger III, “Wanted: Better Benchmarks” Science, May 20, 2005 Alas, despite the promise, we know far more about making wise investments in health, education, finance and workforce than we do in science. How should science best be fostered? The answers to that are not well known but are emerging, in, as Marburger put it “a science of science policy”. What we have learned from this new field can be used by the Science of Learning community as they think through making new investments in the field. The United States established both a White House Interagency Group of the major science agencies and the National Science Foundation established a research program called the Science of Science and Innovation Policy.(SciSIP). Japan and Norway have begun similar programs. The results have led to a US roadmap as well as an EU US roadmap, hard evidence about a variety of different investments and the results of different program structures, and a wealth of additional insights from Science of Science and Innovation Policy researchers Getting the right conceptual and empirical framework matters, lest resources and people get squandered because incentives are wrong. The emerging approach is to recognize that science is fundamentally about the creation, transmission and adoption of ideas not about counting documents. The conceptual and empirical focus is then on identifying and supporting scientists and scientific networks – the Kuhnian trailblazers, pioneers, settlers, sodbusters, ranchers, and developers of science. This is in stark contrast to previous approaches,which treat science as a black box (or a slot machine) where, when large amounts of money are spent then “a miracle occurs” in terms of innovation (Figure 1). The more scientific approach structures measurement to describe who is being funded to collaborate with whom and where to do what (Figure 2). This correctly identifies the change agents as researchers and research networks and renders current approaches, derived from the reporting requirements of previous decades, which arbitrarily ties publications and patents to a single particular funding sources (the right hand side of Figure 1) both misleading and irrelevant. Figure 2 Figure 1 Working from this framework has important science policy implications. It means that the focus of new investments should be on people not documents. Funders should identify good researchers as they are developing, fund them to help build and expand their research networks, reward them for training good graduate and undergraduate students, and build the infrastructure necessary to do their science, rather than building massive infrastructures to count publications and patents as in the United Kingdom. This is all feasible in an era of big data and cyberinfrastructure: existing data can be repurposed and 21st century technologies applied.. Four core steps are necessary to start the process in any country…including developing countries Four key technical steps The first is to build capacity to describe all people working on directly funded science projects – including students. There are two reasons for this. One is that identifying promising and productive individuals and their scientific collaborations is critical to fostering good science and technology transfer. The second is that students play an important and unrecognized role. They can be the key to the transfer of technology from universities to the private sector. The experience of both the United States STAR METRICS and the Australian ASTRA programs is that only fourteen data elements are necessary and that the information can be retrieved from existing payroll systems with relatively low burden and cost. It should be even more straightforward as many developing countries are just starting to build their science funding systems; the systems can be built correctly from the ground up. The second is to build capacity to describe what research Investments are being made: so that research institutions can identify their research strengths, gaps, and the changes over time. It is unnecessary to rely on arbitrarily created taxonomies of science that expect researchers to fill out forms to categorize their activities. Google and other companies do not require anyone to fill out forms to tag billions of documents; they use natural language processing techinques to mine massive amounts of text. . The third is to describe the results of research to permit more credible advocacy and better research management. This can be done by matching in existing datasets, such as patent datasets, scientists’ curricula vitae, and the new ways in which scientists communicate ideas. New tools can be applied to harvest publications, capture scientific activity, and extract data. The fourth is to bring the information together in an easy to use and intuitive framework. Since the community consists of both researchers and policymakers, the goal here is to both create knowledge and to make it useable for policymakers. Some examples of how that research is yielding practical results can be seen from the White House’s prototype R&D Dashboard and the wireframes developed for the French Institut National de Cancer’s HELIOS project. The results in practice As Daniel Kahneman has noted, the first big breakthrough in our understanding of the mechanism of association was an improvement in a method of measurement.. The approach being used, for example, by the Committee on Institutional Cooperation. Is to actively engage research administrators and the SciSIP researchers in each university to: 1. 2. 3. Describe, measure, visualize, and influence the impact of research and its progression from bench to practice by: Capturing, at the most granular level, the collaborations and activities of project teams through successive stage gates of the research process ( Quantifying the impact of access to trained researchers on the employment and economic performance of firms and economies Designing successful public engagements in science and innovation policy Describe, measure, and visualize the breadth of coverage of science by capturing research collaborations Within and across scientific areas With other institutions within the United States and globally With industry Describe, measure and visualize the pipeline of, and outcomes for, students likely to feed into the regional and national economy by matching STAR METRICS workforce data with: Topics and fields of research Starting earnings, employing industries and regional networks by matching to Census Bureau data So, the answer to the question of how might the science of learning centers build the next stage of investment is: use a scientific approach. Build a scientific community and create an intellectually coherent, generalizable and replicable body of measurement and analysis, and use new tools and models to examine the results of the investments from the beginning onward.
