genetic structure of a vulnerable species, the freshwater blenny
advertisement
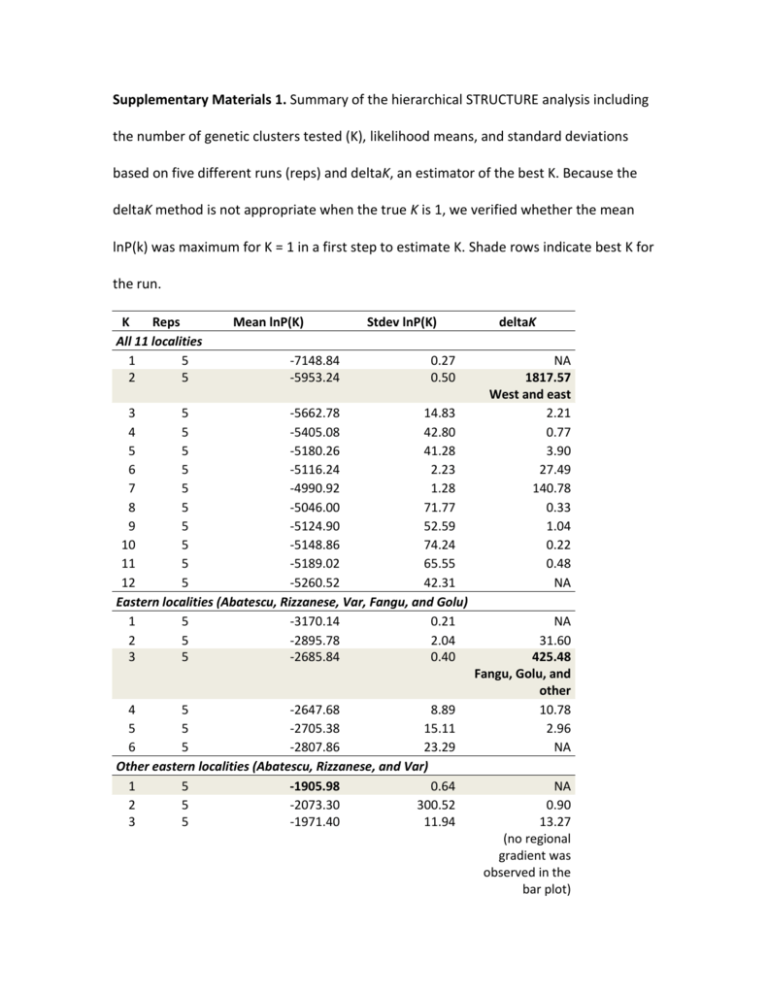
Supplementary Materials 1. Summary of the hierarchical STRUCTURE analysis including the number of genetic clusters tested (K), likelihood means, and standard deviations based on five different runs (reps) and deltaK, an estimator of the best K. Because the deltaK method is not appropriate when the true K is 1, we verified whether the mean lnP(k) was maximum for K = 1 in a first step to estimate K. Shade rows indicate best K for the run. K Reps All 11 localities 1 5 2 5 Mean lnP(K) -7148.84 -5953.24 Stdev lnP(K) 0.27 0.50 3 5 -5662.78 14.83 4 5 -5405.08 42.80 5 5 -5180.26 41.28 6 5 -5116.24 2.23 7 5 -4990.92 1.28 8 5 -5046.00 71.77 9 5 -5124.90 52.59 10 5 -5148.86 74.24 11 5 -5189.02 65.55 12 5 -5260.52 42.31 Eastern localities (Abatescu, Rizzanese, Var, Fangu, and Golu) 1 5 -3170.14 0.21 2 5 -2895.78 2.04 3 5 -2685.84 0.40 4 5 -2647.68 8.89 5 5 -2705.38 15.11 6 5 -2807.86 23.29 Other eastern localities (Abatescu, Rizzanese, and Var) 1 5 -1905.98 0.64 2 5 -2073.30 300.52 3 5 -1971.40 11.94 deltaK NA 1817.57 West and east 2.21 0.77 3.90 27.49 140.78 0.33 1.04 0.22 0.48 NA NA 31.60 425.48 Fangu, Golu, and other 10.78 2.96 NA NA 0.90 13.27 (no regional gradient was observed in the bar plot) 4 5 -2027.94 54.96 NA Western localities (Boughzazene, Sègre, Fluvià, Tech, Annecy, and Bourget) 1 5 -2822.96 0.49 NA 2 5 -2454.20 0.20 1208.20 Rhône and other 3 5 -2327.08 0.40 248.09 4 5 -2298.26 0.56 140.28 5 5 -2347.92 73.45 1.25 6 5 -2305.50 9.36 10.80 7 5 -2364.18 13.60 NA Rhône (Annecy and Bourget) 1 5 -735.94 0.34 NA 2 5 -743.52 4.75 1.03 3 5 -756.00 12.58 NA Other western localities (Boughzazene, Sègre, Fluvià, and Tech) 1 5 -1696.54 0.40 NA 2 5 -1571.54 0.23 603.00 Boughzazene and Pyrenees 3 5 -1585.36 25.07 1.45 4 5 -1562.72 3.85 29.12 5 5 -1652.26 8.02 NA Pyrenees (Sègre, Fluvià, and Tech) 1 5 -1003.16 0.73 NA 2 5 -1035.44 13.60 1.33 3 5 -1085.78 24.90 2.99 4 5 -1061.66 60.03 NA Supplementary Materials 2. Summary of the hierarchical FLOCK analysis including the number of clusters tested (K), the plateau lengths found, the estimate of the best number of clusters, and the decision flow resulting in this estimate (for more details on the decision flow, see Duchesne and Turgeon 2012). ALL 11 localities K Plateau lengths 2 3 4 5 6 7 8 9 10 11 50 3, 2, 2, 2, 2, 20, 2, 2, 2 2, 10, 2, 23, 3, 2 11, 13, 5, 8 3, 4, 13, 3, 5, 4, 3 12, 10, 2, 4 2 0 0 0 Estimate STOP, K =2 (eastern vs. western localities) EAST (Golu, Fangu, Rizzanese, Abatescu, and Var) K Plateau lengths 2 18, 29, 2 3 3, 3, 26, 5, 6, 2 4 5 44 2 Decision flow 1A, 2A Estimate Decision flow STOP, K =4 (Golu, Fangu, Rizzanese, and Ligurian) 1A, 2A LIGURIAN (Abatescu and Var) K Plateau lengths Estimate 2 2, 2, 2 No estimate 3 0 4 0 5 0 6 0 STOP WEST (Boughzazene, Annecy, Bourget, Tech, Fluvià, and Sègre) K Plateau lengths Estimate 2 28, 22 STOP, K =3 3 49 (Boughzazene, Rhône, and Pyrenees) 4 3, 10, 2, 2, 2 Decision flow 2B 1B Decision flow 1A, 2A 5 6 3 0 RHÔNE (Annecy, Bourget) K Plateau lengths 2 20, 3, 2, 2 3 2, 3 4 0 5 0 6 0 PYRENEES (Tech, Fluvià, and Sègre) K Plateau lengths 2 5, ,5, 2, 3, 4, 2 3 0 4 0 5 0 6 0 Estimate K=2 (Annecy, Bourget) Decision flow STOP 1B Estimate No estimate Decision flow 2B STOP 2B
