Remote sensing
Vegetation detection is always the primary interests of remote sensing, and the key for this
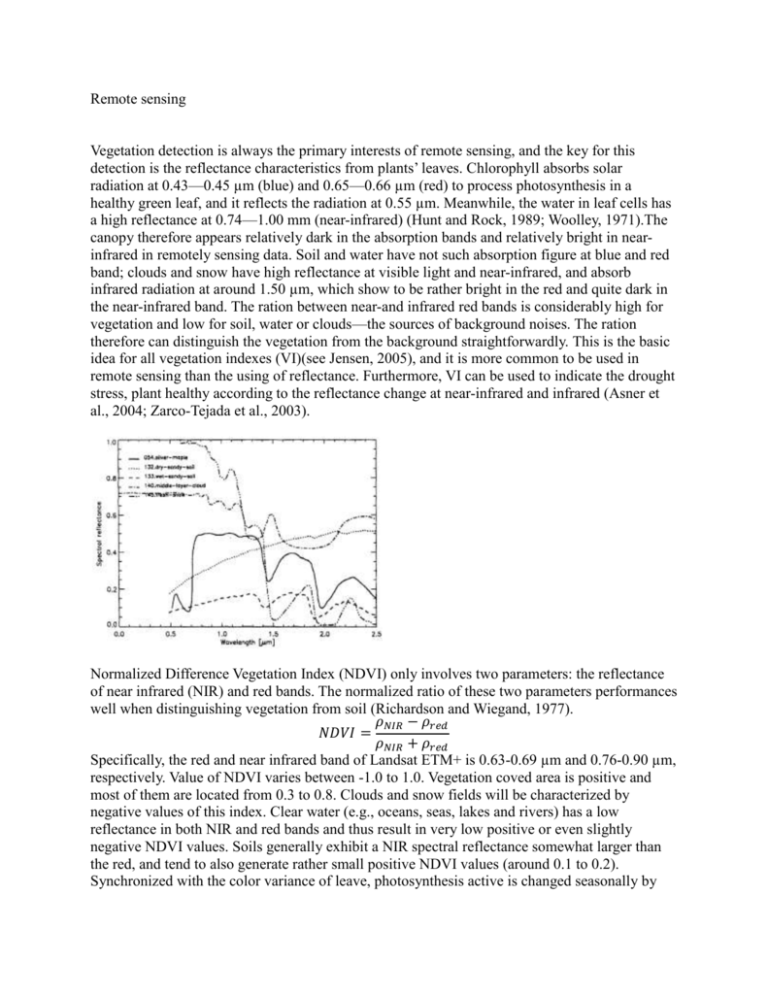
detection is the reflectance characteristics from plants’ leaves. Chlorophyll absorbs solar
radiation at 0.43—0.45 µm (blue) and 0.65—0.66 µm (red) to process photosynthesis in a
healthy green leaf, and it reflects the radiation at 0.55 µm. Meanwhile, the water in leaf cells has
a high reflectance at 0.74—1.00 mm (near-infrared) (Hunt and Rock, 1989; Woolley, 1971).The
canopy therefore appears relatively dark in the absorption bands and relatively bright in nearinfrared in remotely sensing data. Soil and water have not such absorption figure at blue and red
band; clouds and snow have high reflectance at visible light and near-infrared, and absorb
infrared radiation at around 1.50 µm, which show to be rather bright in the red and quite dark in
the near-infrared band. The ration between near-and infrared red bands is considerably high for
vegetation and low for soil, water or clouds—the sources of background noises. The ration
therefore can distinguish the vegetation from the background straightforwardly. This is the basic
idea for all vegetation indexes (VI)(see Jensen, 2005), and it is more common to be used in
remote sensing than the using of reflectance. Furthermore, VI can be used to indicate the drought
stress, plant healthy according to the reflectance change at near-infrared and infrared (Asner et
al., 2004; Zarco-Tejada et al., 2003).
Normalized Difference Vegetation Index (NDVI) only involves two parameters: the reflectance
of near infrared (NIR) and red bands. The normalized ratio of these two parameters performances
well when distinguishing vegetation from soil (Richardson and Wiegand, 1977).
𝜌𝑁𝐼𝑅 − 𝜌𝑟𝑒𝑑
𝑁𝐷𝑉𝐼 =
𝜌𝑁𝐼𝑅 + 𝜌𝑟𝑒𝑑
Specifically, the red and near infrared band of Landsat ETM+ is 0.63-0.69 µm and 0.76-0.90 µm,
respectively. Value of NDVI varies between -1.0 to 1.0. Vegetation coved area is positive and
most of them are located from 0.3 to 0.8. Clouds and snow fields will be characterized by
negative values of this index. Clear water (e.g., oceans, seas, lakes and rivers) has a low
reflectance in both NIR and red bands and thus result in very low positive or even slightly
negative NDVI values. Soils generally exhibit a NIR spectral reflectance somewhat larger than
the red, and tend to also generate rather small positive NDVI values (around 0.1 to 0.2).
Synchronized with the color variance of leave, photosynthesis active is changed seasonally by
the content of chloroplasts. NDVI applied to detect the crop yields and end-of-season aboveground dry biomass. Therefore, NDVI is widely used to detect the vegetation phenology.
Expect changed by biomass, research shows that regional-scale seasonal NDVI is affected
atmospheric conditions associated with aerosols and clouds in tropical forests of Amazon region
(Kobayashi & dye, 2005).
As mentioned above, NDVI value is affected by aerosols and clouds. The wavelength 0.45–.0495
µm (blue band) is sensitive to atmospheric conditions and is often used for atmospheric
correction. MODIS Science Team used blue band to calibrate the reflectance of red and near
infrared band and developed a new index to enhance the quality of NDVI production. The
Enhanced Vegetation Index (EVI) directly adjusts the reflectance in the red band as a function of
the reflectance in the blue band. It was developed to optimize the vegetation signal with
enhanced sensitivity in high biomass regions and reduced atmosphere influences(Huete et al.,
2002).
𝜌𝑁𝐼𝑅 − 𝜌𝑟𝑒𝑑
𝐸𝑉𝐼 = 𝐺
(1 + 𝐿)
𝜌𝑁𝐼𝑅 + 𝐶1 × 𝜌𝑟𝑒𝑑 − 𝐶2 × 𝜌𝑏𝑙𝑢𝑒 + 𝐿
where ρ are atmospherically corrected or partially atmosphere corrected (Rayleigh and ozone
absorption) surface reflectance, L is the canopy background adjustment that addresses nonlinear,
differential NIR and red radiant transfer through a canopy, and C1, C2 are the coefficients of the
aerosol resistance term, which uses the blue band to correct for aerosol influences in the red
band. The value of these coefficients are empirically determined as L=1, C1=6, C2 = 7.5, and G
(gain factor) = 2.5(Huete et al., 1997). The EVI was found to perform well in the heavy aerosol
conditions and soil/vegetation background (Miura et al., 2001; Xiao et al., 2003). Research
showed that EVI
Limited by the spatial resolution, satellite imageries cannot detect the tiny bud or flower on the
top of branch. Reflectance from the forest canopy
Reduce the noise on the time-series data,
However, there are nearly always changes in these profiles caused by cloud contamination, atmospheric
variability and bidirectional effects (Gutman 1991); these changes are usually considered as undesirable
noise in vegetation studies. A widely used method to reduce this noise is the Maximum Value Composite
(MVC) technique proposed by Holben (1986); see the papers cited above, and those in Prince and Justice
(1991).
One approach to deal with this problem is to smooth NDVI pofiles from such data sets using statistical filters
(Dijk er al. 1987, Kogan 1990). However, statistical filters generally do not remove noise (Fuller 1976), and
filtering after compositing severely restricts further analysis. An alternative is to use the original daily
observations and attempt to isolate the 'true' NDVI response of the surface from noise; see for example, the
greatest local slope algorithm, proposed by Shaman et aL (1991).
Here we present another method for extracting NDVI profiles from daily data, the Rest Index Slope Extraction.
The seasonal characteristics of vegetation are generally predictable, depending on ecoclimatic zonation
(Prentice 1990), RISE accounts for the fact that plant growth and development is often asymmetric, i.e.,
periods of growth and senescence are not usually equal, and that in addition to somewhat gradual changes such
as drought induced stress, sudden changes can occur in the vegetation canopy, such as fire, deforestation or
crop harvest. As a performance test, BISE is compared with the MVC technique.
(BISE)(Viovy et al., 1992)
How to define the phenological events ()
Vegetation Index
Albedo
normalized difference water index (Delbart et al., 2005)
Application (Botta et al., 2000; Schwartz et al., 2006; Stockli and Vidale, 2004)
Global leaf onset phenology NOAA AVHRR NDVI(Botta et al., 2000)
Phenotype to genotype
Here, spectype to genotype
Remote sensing approach has previously been used to study phenology in situ (e.g. Delbart et al.,
2005; Kobayashi et al., 2007). However, since heatsum is considered the trigger of some
phenological events, such as budburst or flowering (Reader, 1983), it is possible to interpolate
observed daily climate data to generate a seamless heatsum map according to the greenup days
extracted from remote sensing data. Greenup date is measured as the Julian day when the
satellite imagery pixel starts to green up. This heatsum map can then be considered as a surrogate
for a constant and comparable environment, which allows us to discriminate genotype variations
of the focal species across the general study area. Using remote sensing data to identify greenup
days has been a common practice in remote sensing studies (Delbart et al., 2008; Fisher et al.,
2006; Schwartz et al., 2006). Normalized Difference Vegetation index (NDVI) was often used as
the indicator to identify greenups of an individual species or a species group (Richard and
Poccard, 1998; Wang et al., 2005; White and Nemani, 2006). The other vegetation indices may
also be applied, such as the Enhanced Vegetation Index (EVI) (Sakamoto et al., 2005),
Normalized Difference Water Index (NDWI) (Delbart et al., 2005), Normalized Difference Snow
Index (NDSI) (Salomonson and Appel, 2004), and f-PAR (Ahl et al., 2006).
Ahl D.E., Gower S.T., Burrows S.N., Shabanov N.V., Myneni R.B., Knyazikhin Y. (2006)
Monitoring spring canopy phenology of a deciduous broadleaf forest using MODIS.
Remote Sensing of Environment 104:88-95.
Asner G.P., Nepstad D., Cardinot G., Ray D. (2004) Drought stress and carbon uptake in an
Amazon forest measured with spaceborne imaging spectroscopy. Proceedings of the
National Academy of Sciences of the United States of America 101:6039-6044. DOI:
DOI 10.1073/pnas.0400168101.
Botta A., Viovy N., Ciais P., Friedlingstein P., Monfray P. (2000) A global prognostic scheme of
leaf onset using satellite data. Global Change Biology 6:709-725.
Delbart N., Kergoat L., Le Toan T., Lhermitte J., Picard G. (2005) Determination of phenological
dates in boreal regions using normalized difference water index. Remote Sensing of
Environment 97:26-38. DOI: DOI 10.1016/j.rse.2005.03.011.
Delbart N., Picard G., Le Toans T., Kergoat L., Quegan S., Woodward I., Dye D., Fedotova V.
(2008) Spring phenology in boreal Eurasia over a nearly century time scale. Global
Change Biology 14:603-614.
Fisher J.I., Mustard J.F., Vadeboncoeur M.A. (2006) Green leaf phenology at Landsat resolution:
Scaling from the field to the satellite. Remote Sensing of Environment 100:265-279.
Huete A., Didan K., Miura T., Rodriguez E.P., Gao X., Ferreira L.G. (2002) Overview of the
radiometric and biophysical performance of the MODIS vegetation indices. Remote
Sensing of Environment 83:195-213. DOI: Pii S0034-4257(02)00096-2.
Huete A.R., Liu H.Q., Batchily K., vanLeeuwen W. (1997) A comparison of vegetation indices
global set of TM images for EOS-MODIS. Remote Sensing of Environment 59:440-451.
Hunt E.R., Rock B.N. (1989) Detection of Changes in Leaf Water-Content Using near-Infrared
and Middle-Infrared Reflectances. Remote Sensing of Environment 30:43-54.
Jensen J.R. (2005). 3 ed. Pearson Prentice Hall, Upper Saddle River, N.J.
Kobayashi H., Suzuki R., Kobayashi S. (2007) Reflectance seasonality and its relation to the
canopy leaf area index in an eastern Siberian larch forest: Multi-satellite data and
radiative transfer analyses. Remote Sensing of Environment 106:238-252. DOI: DOI
10.1016/j.rse.2006.08.011.
Miura T., Huete A.R., Yoshioka H., Holben B.N. (2001) An error and sensitivity analysis of
atmospheric resistant vegetation indices derived from dark target-based atmospheric
correction. Remote Sensing of Environment 78:284-298.
Reader R.J. (1983) Using Heatsum Models to Account for Geographic-Variation in the Floral
Phenology of 2 Ericaceous Shrubs. Journal of Biogeography 10:47-64.
Richard Y., Poccard I. (1998) A statistical study of NDVI sensitivity to seasonal and interannual
rainfall variations in Southern Africa. International Journal of Remote Sensing 19:29072920.
Richardson A.J., Wiegand C.L. (1977) Distinguishing Vegetation from Soil Background
Information. Photogrammetric Engineering and Remote Sensing 43:1541-1552.
Sakamoto T., Yokozawa M., Toritani H., Shibayama M., Ishitsuka N., Ohno H. (2005) A crop
phenology detection method using time-series MODIS data. Remote Sensing of
Environment 96:366-374.
Salomonson V.V., Appel I. (2004) Estimating fractional snow cover from MODIS using the
normalized difference snow index. Remote Sensing of Environment 89:351-360.
Schwartz M.D., Ahas R., Aasa A. (2006) Onset of spring starting earlier across the Northern
Hemisphere. Global Change Biology 12:343-351. DOI: DOI 10.1111/j.13652486.2005.01097.x.
Stockli R., Vidale P.L. (2004) European plant phenology and climate as seen in a 20-year
AVHRR land-surface parameter dataset. International Journal of Remote Sensing
25:3303-3330. DOI: Doi 10.1080/01431160310001618149.
Viovy N., Arino O., Belward A.S. (1992) The Best Index Slope Extraction (Bise) - a Method for
Reducing Noise in Ndvi Time-Series. International Journal of Remote Sensing 13:15851590.
Wang Q., Adiku S., Tenhunen J., Granier A. (2005) On the relationship of NDVI with leaf area
index in a deciduous forest site. Remote Sensing of Environment 94:244-255.
White M.A., Nemani R.R. (2006) Real-time monitoring and short-term forecasting of land
surface phenology. Remote Sensing of Environment 104:43-49.
Woolley J.T. (1971) Reflectance and Transmittance of Light by Leaves. Plant Physiology
47:656-&.
Xiao X.M., Braswell B., Zhang Q.Y., Boles S., Frolking S., Moore B. (2003) Sensitivity of
vegetation indices to atmospheric aerosols: continental-scale observations in Northern
Asia. Remote Sensing of Environment 84:385-392. DOI: Pii S0034-4257(02)00129-3.
Zarco-Tejada P.J., Rueda C.A., Ustin S.L. (2003) Water content estimation in vegetation with
MODIS reflectance data and model inversion methods. Remote Sensing of Environment
85:109-124. DOI: Doi 10.1016/S0034-4257(02)00197-9.

