Geometrical-Optics Model and Error Analysis of Concentrated
advertisement

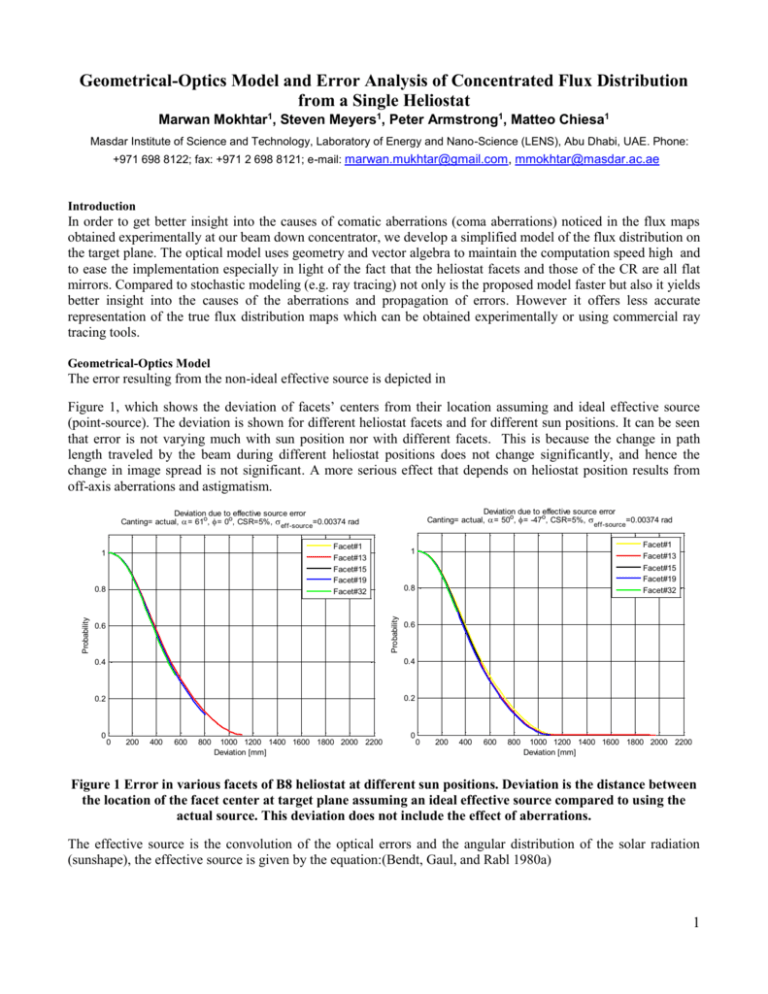
Geometrical-Optics Model and Error Analysis of Concentrated Flux Distribution from a Single Heliostat Marwan Mokhtar1, Steven Meyers1, Peter Armstrong1, Matteo Chiesa1 Masdar Institute of Science and Technology, Laboratory of Energy and Nano-Science (LENS), Abu Dhabi, UAE. Phone: +971 698 8122; fax: +971 2 698 8121; e-mail: marwan.mukhtar@gmail.com, mmokhtar@masdar.ac.ae Introduction In order to get better insight into the causes of comatic aberrations (coma aberrations) noticed in the flux maps obtained experimentally at our beam down concentrator, we develop a simplified model of the flux distribution on the target plane. The optical model uses geometry and vector algebra to maintain the computation speed high and to ease the implementation especially in light of the fact that the heliostat facets and those of the CR are all flat mirrors. Compared to stochastic modeling (e.g. ray tracing) not only is the proposed model faster but also it yields better insight into the causes of the aberrations and propagation of errors. However it offers less accurate representation of the true flux distribution maps which can be obtained experimentally or using commercial ray tracing tools. Geometrical-Optics Model The error resulting from the non-ideal effective source is depicted in Figure 1, which shows the deviation of facets’ centers from their location assuming and ideal effective source (point-source). The deviation is shown for different heliostat facets and for different sun positions. It can be seen that error is not varying much with sun position nor with different facets. This is because the change in path length traveled by the beam during different heliostat positions does not change significantly, and hence the change in image spread is not significant. A more serious effect that depends on heliostat position results from off-axis aberrations and astigmatism. Deviation due to effective source error Canting= actual, = 50o, = -47o, CSR=5%, eff-source=0.00374 rad Deviation due to effective source error Canting= actual, = 61o, = 0o, CSR=5%, eff-source=0.00374 rad Facet#1 Facet#13 Facet#15 Facet#19 Facet#32 1 0.8 Probability Probability 0.8 0.6 0.6 0.4 0.4 0.2 0.2 0 0 200 400 600 800 1000 1200 1400 1600 1800 2000 2200 Deviation [mm] Facet#1 Facet#13 Facet#15 Facet#19 Facet#32 1 0 0 200 400 600 800 1000 1200 1400 1600 1800 2000 2200 Deviation [mm] Figure 1 Error in various facets of B8 heliostat at different sun positions. Deviation is the distance between the location of the facet center at target plane assuming an ideal effective source compared to using the actual source. This deviation does not include the effect of aberrations. The effective source is the convolution of the optical errors and the angular distribution of the solar radiation (sunshape), the effective source is given by the equation:(Bendt, Gaul, and Rabl 1980a) 1 +∞ Beff (θ) = ∫−∞ 1 θ′2 ∗ exp (− 2σ2 2𝜋 σoptical √ optical (1) ) ∗ Bsunshape (θ − θ′) dθ′ Where: θ is the angular deviation of the falling ray from the ideal ray, for perfect optics and ideal point source θ will be zero [mrad],Beff is the effective source [W/m2/str],Bsunshape is the angular solar distribution[W/m2/str], σoptical is the RMS width of the optical errors normal distribution [mrad]. In Figure 2-left we can see the deviation of facet centers from the ideal position at origin and for different sun positions. The facet centers are shown for an ideal effective source in red, and including an effective error in azimuth and elevation in blue. On the right side of Error! Not a valid bookmark self-reference., the actual flux maps taken by the CCD are shown, these flux maps were taken at the corresponding sun position. Visually comparing the simulated and actual flux maps, one can infer that the model is able to predict off-axis aberrations (occurring at non-normal angles of incidence). In addition the size of the actual heliostat image is a bit larger than the simulated image, which is expected since the model only traces the facets’ centers and not the edges. The model also reports the percentage of lost radiation that does not fall on the CR mirror corresponding to the heliostat in question, it can be seen that spillage is minimum at noon (second plot) and increases as it deviates from that point. In the actual flux maps we can see some of the radiation reflected by the wrong CR mirror around the heliostat main focus. = 61o, = 0o, d = 0.5o, d = 0.5o Canting:actual, SpillageIdeal= 0%, Spillagew / error= 5% Actual Flux Map Standard Time: 12:30, = 61o, = 0o 2500 2500 Ideal efffective source w/ errors d ,d 2000 1500 1500 1000 1000 500 500 X "mm" X "mm" 2000 0 -500 -500 -1000 -1000 -1500 -1500 -2000 -2500 -2500 -2000 -1500 -1000 -0 -2000 -500 0 Y "mm" 500 1000 1500 2000 2500 -2500 -2500 -2000 -1500 -1000 -500 0 500 Y "mm" 1000 1500 2000 2500 Figure 2 Left: facet centers on target plane deviated from ideal location at origin (0,0). Red points showing deviation assuming an ideal effective source. Blue points include both aberrations and an effective error in elevation and azimuth, of dα and dφ respectively. Spillage values for both the ideal and deviated rays are also reported. Right: Actual flux map captured by the CCD camera at a sun position corresponding to the one simulated, scattered radiation reflected by the neighboring CR mirror is circled. Conclusion The proposed model provides an understanding of the sources of aberration in the flux maps obtained experimentally with our bema down concentrator. The effects of different optical errors and sunshape on the quality of concentration can also be evaluated with the model. The ability to introducechanging values of errors and sunshapes while still maintaining calculation speed facilitates simulation of different scenarios and study og the effects of sunshape and design parameters such as canting angles, receiver size etc. without the need for long simulation times or complex ray tracing tools. 2 3


