GetData
Attendance Reports
What types of Attendance Reports can be utilized through GetData?
There are several reports that can help you identify a wide-array of specific attendance information.
The attendance reports are as follows: Month-to-Month Comparisons, Grade Span Comparisons,
Attendance by Location By Month, Revenue Lost, Daily Absences, Subgroup Comparisons, Truancy, AtRisk Attendance, and Location Comparisons.
*GetData works best using the Mozilla Firefox browser.
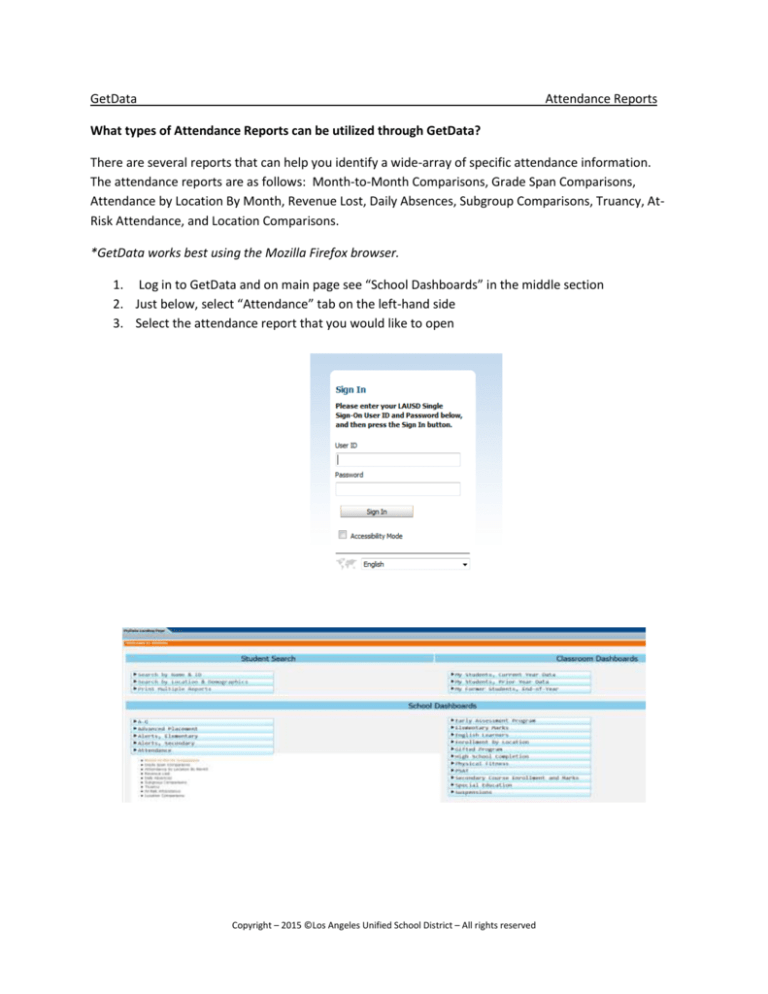
1. Log in to GetData and on main page see “School Dashboards” in the middle section
2. Just below, select “Attendance” tab on the left-hand side
3. Select the attendance report that you would like to open
Copyright – 2015 ©Los Angeles Unified School District – All rights reserved
Month-to-Month Comparisons
Once you have selected this report, enter in the “Filters” on the left-hand column to select your <<Local
District>> and Preferred Location [School] and select “Apply.”
You may view the Month-to-Month Attendance report to see information for specifically the current
school year, or you may view the Month-to-Month Attendance, Two Year Comparison to see how the
current school year’s data compares to a previous school year (dating as far back as 2009-2010).
Please note: Information may be displayed either as “Cumulative Attendance” or “Monthly
Attendance.”
Copyright – 2015 ©Los Angeles Unified School District – All rights reserved
Grade Span Comparisons
Once you have selected this report, enter in the “Filters” on the left-hand column to select your <<Local
District>> and Preferred Location [School] and select “Apply.”
This report is useful for grade level competitions and in recognizing trends or patterns among different
grade levels. This report can also be viewed as “Cumulative Attendance” or “Monthly Attendance,” and
you can look at specific attendance demographics, such as by grade level, gender, ethnicity, and more.
Once complete, this report can be printed or exported.
Copyright – 2015 ©Los Angeles Unified School District – All rights reserved
Attendance by Location By Month
Once you have selected this report, enter in the “Filters” on the left-hand column to select your << Local
District >> and Preferred Location [School] and select “Apply.”
This report is helpful when you want to see a year’s view of attendance, and to see if there is an increase
or decrease in attendance rates by month. This report can also be viewed as “Cumulative Attendance”
or “Monthly Attendance,” and you can look at specific attendance demographics, such as by grade level,
gender, ethnicity, and more. The data can also be “Summarized by” preferred location name, << Local
District >>, complex name, and school location name. Once complete, this report can be printed or
exported.
Copyright – 2015 ©Los Angeles Unified School District – All rights reserved
Revenue Lost
Once you have selected this report, enter in the “Filters” on the left-hand column to select your << Local
District >> and Preferred Location [School] and select “Apply.”
This report compares current year with the previous school year. The data can also be “Summarized by”
month, ethnicity, gender, grade and language. Once complete, this report can be printed or exported.
This report is particularly helpful to share with your Administrators and your School Site Council because
it clearly shows the amount of revenue lost due to non-attendance, and subsequently, revenue gained
due to increased attendance. It is also helpful to show this information to the Parent Advisory Councils
and during other parent meetings (e.g., ELAC, etc.) to clearly demonstrate the impact that lost
attendance can have on the entire school. This report is especially useful when budgets are being
created for the following school year, and PSA Counselor purchase-time is being considered.
Copyright – 2015 ©Los Angeles Unified School District – All rights reserved
Daily Absences
Once you have selected this report, enter in the “Filters” on the left-hand column to select your << Local
District >> and Preferred Location [School] and select “Apply.”
This report shows the attendance for a specific school week. Please select the week you would like by
clicking on the tab on the upper left corner and selecting “Apply.”
This report is helpful for reviewing a specific week of attendance, and is oftentimes used to review
attendance data for the week of testing, finals, before and after holidays/recesses, inclement weather
trends, and many more. The reports can be viewed by “# of Students” and “# of Students.”
Copyright – 2015 ©Los Angeles Unified School District – All rights reserved
Subgroup Comparisons
Once you have selected this report, enter in the “Filters” on the left-hand column to select your
Educational Service Center and Preferred Location [School] and select “Apply.”
This report shows cumulative attendance. The data can also be “Summarized by” ethnicity, gender,
grade level and language class code. Once complete, this report can be printed or exported. This report
is useful for grade level competitions, collection of demographic information, and identifying EL
students’ attendance, just to name a few examples.
Copyright – 2015 ©Los Angeles Unified School District – All rights reserved
Truancy
Once you have selected this report, enter in the “Filters” on the left-hand column to select your << Local
District >> and Preferred Location [School] and select “Apply.”
The information in this report shows the cumulative rates of truancy for a specific school, << Local
District >>, or the entire Los Angeles Unified School District. This report may be viewed from as far back
as the 2009-2010 school year in order to compare truancy rates. The specific information in this truancy
classification report may include the following filters: school year, track, grade level, language
classification, ethnicity, gender, gifted, SPED, and foster youth status. If no filters are identified, the
report will include all students. The information in this report is shown via bar graph, number of
students and percentage of students.
The graph below indicates the attendance reason codes that, when entered into MISIS, will be
considered for this report.
Copyright – 2015 ©Los Angeles Unified School District – All rights reserved
At-Risk Attendance
Once you have selected this report, enter in the “Filters” on the left-hand column to select your
Educational Service Center and Preferred Location [School] and select “Apply.”
This report clearly illustrates student attendance by attendance band. This is a very useful “at-a-glance”
report. The specific information may include the following filters: grade level, grad year, school month,
school year, and several more. The example below is displayed to show the grade level subgroups, by
both percentage and number of students.
Once you have populated this report, you may print or export the information, but you may also get
even more detailed information by selecting any of the blue hyperlinked boxes to see the identified
students for each category. This can assist with identifying which students will need more intensive
services and interventions, or those students to be acknowledged and recognized with attendance
incentives, etc. An example of the twelfth grade students identified with 100% advanced attendance
during the month of June may be seen below.
Copyright – 2015 ©Los Angeles Unified School District – All rights reserved
Location Comparisons
Once you have selected this report, enter in the “Filters” on the left-hand column to select your
Educational Service Center and Preferred Location [School] and select “Apply.”
This report is useful when you need to compare attendance band information as it compares to other
schools by << Local District >>,school campus, level (e.g., elementary, middle, high school), or districtwide. Similar to the other reports, you may click on the blue hyperlinked tabs for detailed information
(e.g., student names, etc.). Or, you may view an individual school’s attendance data. The example
below shows the attendance by band for all of the middle schools in << Local District >> during the
month of September 2014. The information is displayed by percentage, but it can also be displayed as
number of students, or both percentage and number of students.
Copyright – 2015 ©Los Angeles Unified School District – All rights reserved
Comprehensive Student History Reports
To obtain this next report, once logged on you will go to the GetData Landing Page:
1. On the left-hand side below “Student Search” select “Search by Name & ID”
2. This will open up a new window and on the left-hand side of this page under “Basic Filters”
enter the student’s last name and first name (in uppercase letters)
(Please note: Because this report searches the entire school district, if you have a student with a
commonly recognized name, you will need to enter the “Student ID” or at least a partial
birthdate to narrow down the search.)
3. Once the search is complete, narrow down or simply select the student clicking on their
“District ID” number
4. You will be redirected to a new window with the “Comprehensive Student History Report –
Summary”
The Comprehensive Student History Report – Summary is a very useful report to obtain a great deal of
useful “at-a-glance” information about a student, including: Attendance, State Assessments and Test
Scores, IEP History, and Suspension/Discipline History, just to name a few. Each report “within” this
report is hyperlinked, so clicking on any of these will give you a more comprehensive look.
Copyright – 2015 ©Los Angeles Unified School District – All rights reserved
The Comprehensive Student History Report - Attendance may be selected by clicking the blue
hyperlinked “Attendance” tab under the “Student History” column on the left-hand side. This report is
extremely useful when you are referring a student to be SART/SARB’d. The Comprehensive Student
History Report - Attendance will show you the entire attendance history for a student as long as they
have attended in the Los Angeles Unified School District. This report will show you the cumulative
number of full-day absences and partial-day absences per each school year, as well as the cumulative
sum of all years combined.
Disclaimer: The information found on GetData is the property of the Los Angeles Unified School District
and is intended solely for the internal use by authorized employees. This information is not to be
reproduced in any form, viewed, or distributed by unauthorized individuals. This information is subject
to conditions set forth in applicable laws, regulations, and policies regarding privacy and confidentiality.
Copyright – 2015 ©Los Angeles Unified School District – All rights reserved


