Weather Example - Scott County Schools
advertisement
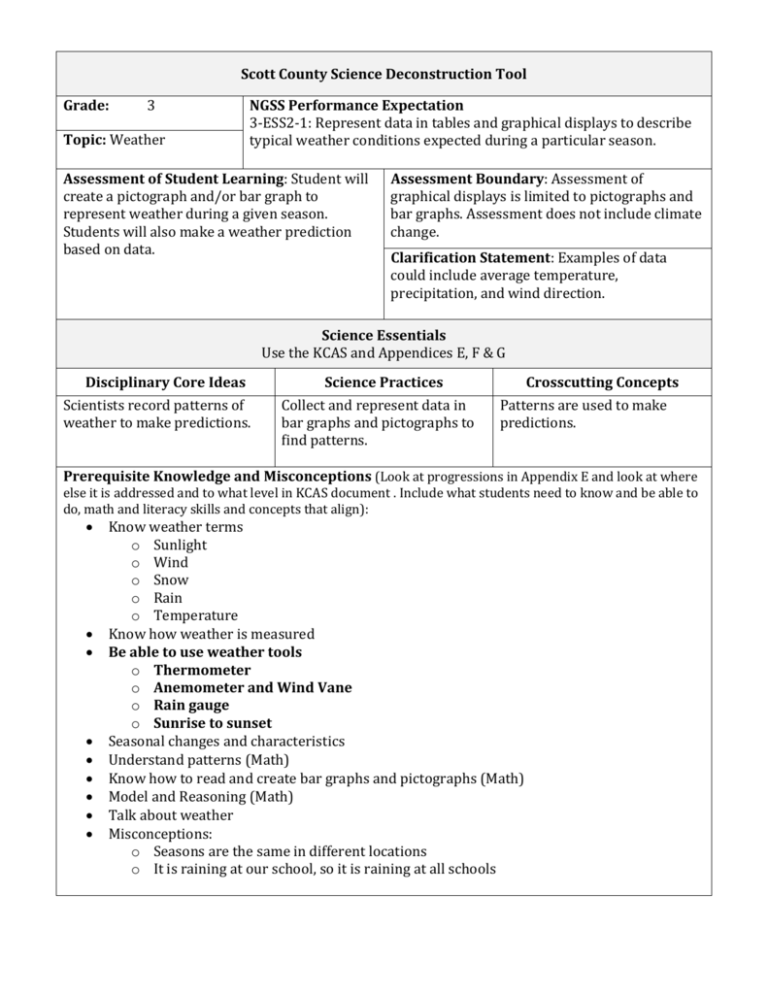
Scott County Science Deconstruction Tool Grade: 3 Topic: Weather NGSS Performance Expectation 3-ESS2-1: Represent data in tables and graphical displays to describe typical weather conditions expected during a particular season. Assessment of Student Learning: Student will create a pictograph and/or bar graph to represent weather during a given season. Students will also make a weather prediction based on data. Assessment Boundary: Assessment of graphical displays is limited to pictographs and bar graphs. Assessment does not include climate change. Clarification Statement: Examples of data could include average temperature, precipitation, and wind direction. Science Essentials Use the KCAS and Appendices E, F & G Disciplinary Core Ideas Scientists record patterns of weather to make predictions. Science Practices Collect and represent data in bar graphs and pictographs to find patterns. Crosscutting Concepts Patterns are used to make predictions. Prerequisite Knowledge and Misconceptions (Look at progressions in Appendix E and look at where else it is addressed and to what level in KCAS document . Include what students need to know and be able to do, math and literacy skills and concepts that align): Know weather terms o Sunlight o Wind o Snow o Rain o Temperature Know how weather is measured Be able to use weather tools o Thermometer o Anemometer and Wind Vane o Rain gauge o Sunrise to sunset Seasonal changes and characteristics Understand patterns (Math) Know how to read and create bar graphs and pictographs (Math) Model and Reasoning (Math) Talk about weather Misconceptions: o Seasons are the same in different locations o It is raining at our school, so it is raining at all schools Student Science Performance Highlight and add how each will be addressed within this Performance Expectation. Gathering Watching and recording the weather Obtain Information What is the weather today? Ask Questions/Define Problems Plan and Carry Out Investigations Set parameters for recording daily weather data. Use Models to Gather Data Putting the weather information in a table. Use Mathematics and Computational Thinking Reasoning Evaluate Information Analyze Data Use Mathematics and Computational Thinking Construct Explanations/Solve Problems Develop Arguments from Evidence Use Models to Predict and Develop Evidence How is the weather being measured at different places? Checking for validity of data. Looking for patterns in weather data. For example, looking at rain in spring compared to rain in fall. Comparing temperature, rain, and other weather conditions. For example, how much more did it rain today than yesterday? Using weather patterns to make predictions using supporting evidence. Using bar graphs and/or pictographs to make and support predictions. Communicating Communicate Information Argue from Evidence (written & oral) Use Models to Communicate Representing the data in bar graphs and/or pictographs in order to communicate. Predictions of weather. Moving NGSS to Instruction What is the intent of the PE/learning? What depth is intended? What are the key concepts for learning? What will students need to know or do to show mastery? Knowledge GAP Skill: identify basic weather tools and their uses Identify and compare characteristics of different seasons Reasoning AND Skill/Performance GAP Skill: use a variety of weather tools, including thermometer, anemometer, wind vane, and rain gauge Analyze weather data in a table to determine patterns in particular seasons Analyze pictographs and bar graphs to determine weather patterns Use a table to collect weather data Use weather patterns to describe typical weather conditions for each season Use weather patterns to make predictions about future weather Products Create a table to show weather data Create a bar graph and pictograph to show weather data


