Supplementary Text
advertisement

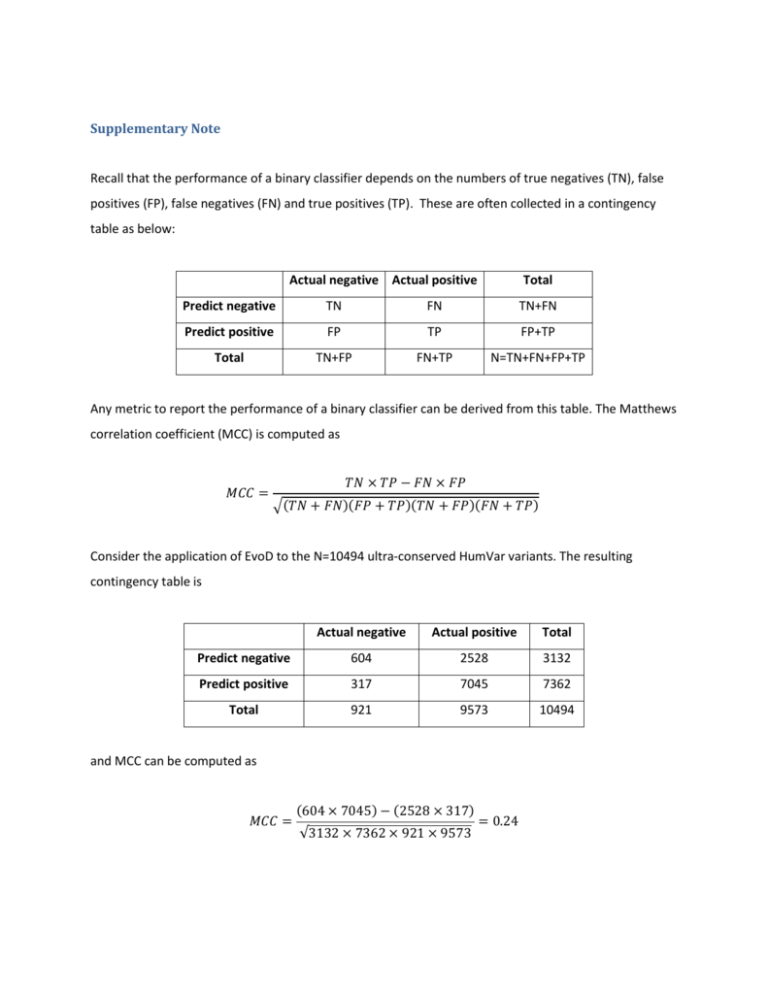
Supplementary Note Recall that the performance of a binary classifier depends on the numbers of true negatives (TN), false positives (FP), false negatives (FN) and true positives (TP). These are often collected in a contingency table as below: Actual negative Actual positive Total Predict negative TN FN TN+FN Predict positive FP TP FP+TP Total TN+FP FN+TP N=TN+FN+FP+TP Any metric to report the performance of a binary classifier can be derived from this table. The Matthews correlation coefficient (MCC) is computed as 𝑀𝐶𝐶 = 𝑇𝑁 × 𝑇𝑃 − 𝐹𝑁 × 𝐹𝑃 √(𝑇𝑁 + 𝐹𝑁)(𝐹𝑃 + 𝑇𝑃)(𝑇𝑁 + 𝐹𝑃)(𝐹𝑁 + 𝑇𝑃) Consider the application of EvoD to the N=10494 ultra-conserved HumVar variants. The resulting contingency table is Actual negative Actual positive Total Predict negative 604 2528 3132 Predict positive 317 7045 7362 Total 921 9573 10494 and MCC can be computed as 𝑀𝐶𝐶 = (604 × 7045) − (2528 × 317) √3132 × 7362 × 921 × 9573 = 0.24 The main text notes that the balanced version of MCC (BMCC) relates to MCC through the class imbalance ratio r = (TN+FP)/(FN+TP), here r = 921/9573 0.1. In general, BMCC rescales the entries in the contingency table as: Actual negative Actual positive Total Predict negative TN (1+1/r)/2 FN (1+r)/2 (TN (1+1/r)/2) + (FN (1+r)/2) Predict positive FP (1+1/r)/2 TP (1+r)/2 (FP (1+1/r)/2) + (TP (1+r)/2) Total N/2 N/2 N = TN+FN+FP+TP For this example specifically, the result is (up to rounding): Actual negative Actual positive Total Predict negative 3441 1386 4827 Predict positive 1806 3861 5667 Total 5247 5247 10494 Applying the formula for MCC to this table gives the value of BMCC as 𝐵𝑀𝐶𝐶 = (3441 × 3861) − (1386 × 1806) √4827 × 5667 × 5247 × 5247 = 0.39 Qualitatively, BMCC forces the negative and positive classes to be balanced while preserving the predictive accuracy within each. As compared to MCC, this gives predictions in the underrepresented class more influence on the calculation. To see how, it is helpful to think of MCC as the correlation between two binary vectors: the vector of predictions and the vector of truth. The vector of predictions records a “1” for each predicted positive and “0” for each predicted negative; the vector of truth records a “1” for each actual positive and “0” for each actual negative. MCC is the Pearson correlation coefficient between these two vectors, and one can consider the associated scatterplot. If the x-axis corresponds to prediction and the y-axis corresponds to truth, the scatterplot associated with MCC will have TN points at (0,0), FN points at (0,1), FP points at (1,0) and TP points at (1,1). By contrast, the scatterplot associated with BMCC adjusts the number of points at each location as described above; in particular, the number of points with y = 0 is forced to equal the number of points with y = 1.


