Conditional Probability Worksheet
advertisement
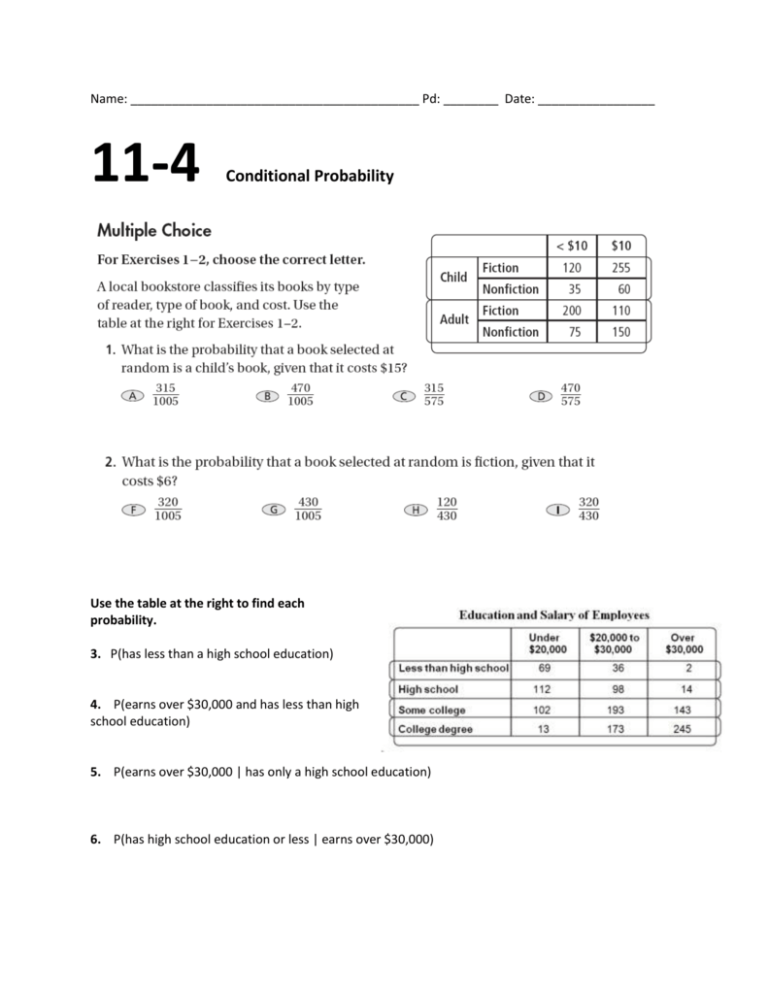
Name: __________________________________________ Pd: ________ Date: _________________ 11-4 Conditional Probability Use the table at the right to find each probability. 3. P(has less than a high school education) 4. P(earns over $30,000 and has less than high school education) 5. P(earns over $30,000 | has only a high school education) 6. P(has high school education or less | earns over $30,000) Use the table to find each probability. The tables gives information about students at one school. 7. P(sports|female) 8. P(female|sports) 9. P(reading|male) 10. P(male|reading) 11. P(shopping|male) 12. (female|shopping) You survey a group of juniors and seniors. The tree diagram relates a student’s class and whether a student is employed after school. Find each probability. Let J, S, E, and U represent junior, senior, employed, and unemployed, repectively. 13. P(E) 14. P(J and U) 15. P(S|E) 16. P(J|U)
