Chapter 8 Population Change Lecture Outline
advertisement
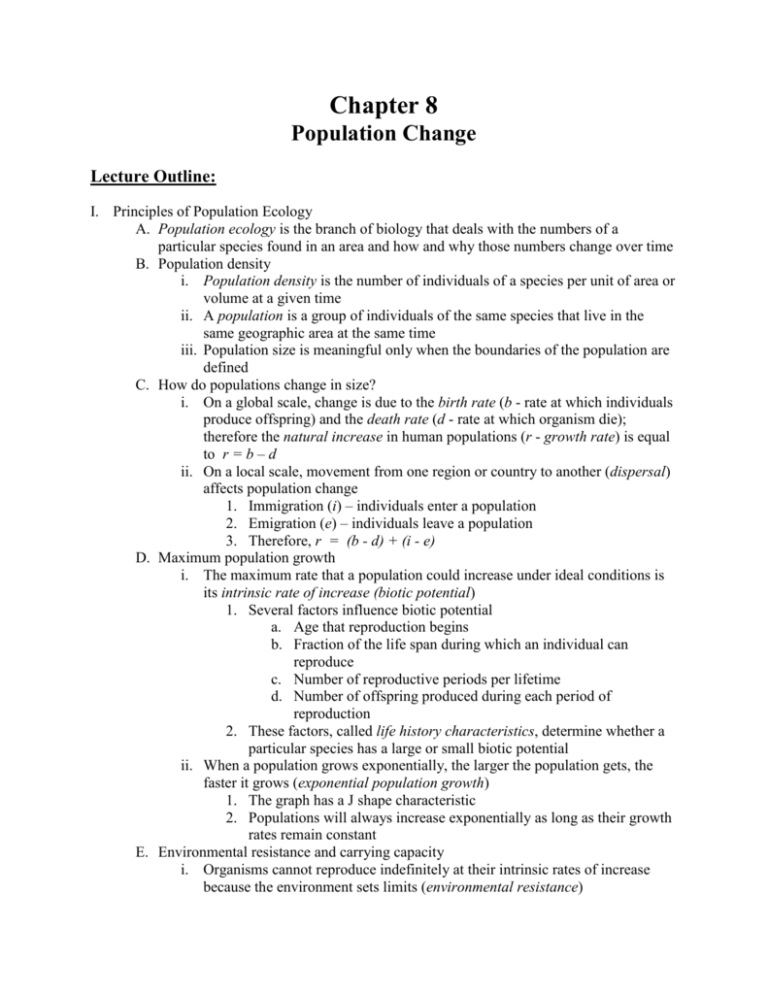
Chapter 8 Population Change Lecture Outline: I. Principles of Population Ecology A. Population ecology is the branch of biology that deals with the numbers of a particular species found in an area and how and why those numbers change over time B. Population density i. Population density is the number of individuals of a species per unit of area or volume at a given time ii. A population is a group of individuals of the same species that live in the same geographic area at the same time iii. Population size is meaningful only when the boundaries of the population are defined C. How do populations change in size? i. On a global scale, change is due to the birth rate (b - rate at which individuals produce offspring) and the death rate (d - rate at which organism die); therefore the natural increase in human populations (r - growth rate) is equal to r = b – d ii. On a local scale, movement from one region or country to another (dispersal) affects population change 1. Immigration (i) – individuals enter a population 2. Emigration (e) – individuals leave a population 3. Therefore, r = (b - d) + (i - e) D. Maximum population growth i. The maximum rate that a population could increase under ideal conditions is its intrinsic rate of increase (biotic potential) 1. Several factors influence biotic potential a. Age that reproduction begins b. Fraction of the life span during which an individual can reproduce c. Number of reproductive periods per lifetime d. Number of offspring produced during each period of reproduction 2. These factors, called life history characteristics, determine whether a particular species has a large or small biotic potential ii. When a population grows exponentially, the larger the population gets, the faster it grows (exponential population growth) 1. The graph has a J shape characteristic 2. Populations will always increase exponentially as long as their growth rates remain constant E. Environmental resistance and carrying capacity i. Organisms cannot reproduce indefinitely at their intrinsic rates of increase because the environment sets limits (environmental resistance) 1. Environmental resistance includes environmental conditions that limit availability of food, water and shelter; as well as limits imposed by disease, predation and competition 2. Environmental resistance is an excellent example of a negative feedback mechanism 3. When a population affected by environmental resistance is graphed over a long period, the curve has the characteristic S shape of logistic population growth ii. The maximum number of individuals of a given species that a particular environment can support for an indefinite period, assuming there are no changes in the environment, is termed carrying capacity (K) 1. In nature, the carrying capacity is dynamic and changes in response to environmental changes 2. Sometimes a population that overshoots K will experience a population crash II. Factors That Affect Population Size A. Density-dependent factors i. Density-dependent factors (predation, disease, competition)are environmental factors whose effects on a population change as population density changes (ex., predation has a greater influence on a population when its population is greater ii. As population density increases, density-dependent factors tend to slow population growth by causing an increase in death and/or a decrease in birth rate B. Density-independent factors i. Density-independent factors are environmental factors that affect the size of a population but are not influenced by changes in population density ii. Severe weather conditions are an example of density-independent factors III. Reproductive Strategies A. Each species has its own life history strategy – its own reproductive characteristics, body size, habitat requirements, migration patterns, and behaviors – that represents a series of tradeoffs reflecting an energy compromise between survival and reproduction i. r strategists (r-selected species) have traits that contribute to a high population growth rate (i.e., small body size, early maturity, short life span, large broods, little/no parental care) ii. K strategists (K-selected species) maximize the chance of surviving in an environment where the number of individuals (N) is near K of the environment 1. They have characteristically long life spans with slow development, late reproduction, large body size, and low reproductive rates 2. K strategists are found in relatively constant or stable environments, where they have high competitive ability B. Survivorship i. Ecologists construct life tables for plants and animals that show the likelihood of survival for individuals at different times during their lives ii. Survivorship is the proportion of newborn individuals that are alive at a given age 1. Type I – young and those at reproductive age have a high probability of living, the probability of survival decreases more rapidly with increasing age, death is concentrated later in life (humans, elephants) 2. Type II – the probability of survival does not change with age (lizards) 3. Type III – the probability of death is greatest early in life, those that avoid early death subsequently have a high probability of survival (fishes, oysters) IV. The Human Population A. Demography is the science of population structure and growth; the application of population statistics is called demographics B. Current population numbers i. In 2006, the world population was 6.6 billion ii. While the world birth rate (b) has declined during the last 200 years, there has been a dramatic decline in the death rate (d), leading to an overall increase in population C. Projecting future population numbers i. The world growth rate (r) has declined over the past several years, from a peak of 2.2% per year in the 1960s to 1.2% in 2006; it is projected that a zero population growth will occur at the end of the 21st century ii. The main unknown factor in any population growth scenario is Earth’s carrying capacity (K) V. Demographics of Countries A. Population differences occur from country to country i. Highly developed countries (HDCs - i.e., United States, Canada, France, Germany, Japan, Australia, etc.) have low rates of population growth, are highly industrialized, have low birth rates, and low infant mortality rates ii. Moderately developed countries (MDCs - i.e., Mexico, Thailand, Turkey, etc.) have relatively higher birth rates and infant mortality rates than HDCs, medium level of industrialization, and their average per capita GNI PPPs are lower than HDCs iii. Less developed countries (LDCs – i.e., Bangladesh, Ethiopia, Cambodia, etc.) have the highest birth rates, the highest infant mortality rates, the shortest life expectancies, and the lowest average per capita GNI PPPs in the world B. One way to express the population growth of a country is to determine its doubling time (td) C. Replacement-level fertility is the number of children a couple must produce to “replace” themselves (=2.1); the current worldwide total fertility rate is currently 2.7 D. Demographic stages i. The demographic transition consists of four demographic stages through which a population progresses as its society becomes industrialized ii. The four stages are preindustrial, transitional, industrial, and postindustrial E. Age structure of countries i. To predict the future growth of a population, you must know its distribution of people by age (age structure) ii. Age structure diagrams depict expanding populations, stable populations and declining populations iii. A population growth momentum explains how the present age distribution affects the future growth of a population VI. Demographics of the United States A. The United States has the largest population of all HDCs, and continues to grow significantly due to immigration i. International immigration is responsible for more than 50% of U.S. population growth ii. The U.S. has one of the highest rates of population increase of all the HDCs B. History of immigration in the United States i. Pre 1875, the U.S. had no immigration laws ii. 1875 – no convicts and prostitutes allowed in U.S. iii. 1882 – Chinese Exclusion Act passed iv. 1891 –the Bureau of Immigration was established which led to an official policy of selective exclusion in the U.S v. 1952 – the Immigration and Nationality Act was passes (aka IRCA) vi. Currently, the top five countries from which legal U. S. immigrants migrate are Mexico, the Philippines, Vietnam, the Dominican Republic, and China
