Table S1. Efficiencies (%) of transient transfections of the cell lines
advertisement
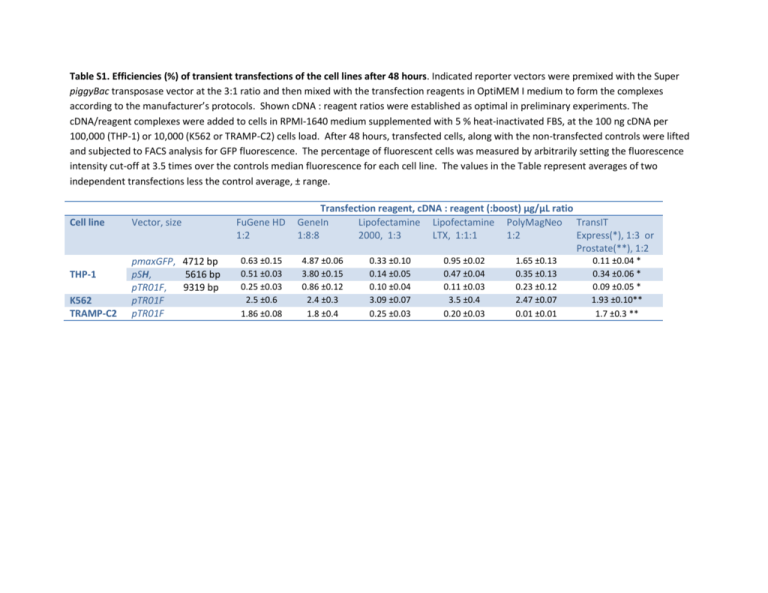
Table S1. Efficiencies (%) of transient transfections of the cell lines after 48 hours. Indicated reporter vectors were premixed with the Super piggyBac transposase vector at the 3:1 ratio and then mixed with the transfection reagents in OptiMEM I medium to form the complexes according to the manufacturer’s protocols. Shown cDNA : reagent ratios were established as optimal in preliminary experiments. The cDNA/reagent complexes were added to cells in RPMI-1640 medium supplemented with 5 % heat-inactivated FBS, at the 100 ng cDNA per 100,000 (THP-1) or 10,000 (K562 or TRAMP-C2) cells load. After 48 hours, transfected cells, along with the non-transfected controls were lifted and subjected to FACS analysis for GFP fluorescence. The percentage of fluorescent cells was measured by arbitrarily setting the fluorescence intensity cut-off at 3.5 times over the controls median fluorescence for each cell line. The values in the Table represent averages of two independent transfections less the control average, ± range. Cell line THP-1 K562 TRAMP-C2 Vector, size pmaxGFP, 4712 bp pSH, 5616 bp pTR01F, 9319 bp pTR01F pTR01F FuGene HD 1:2 0.63 ±0.15 0.51 ±0.03 0.25 ±0.03 2.5 ±0.6 1.86 ±0.08 Transfection reagent, cDNA : reagent (:boost) μg/μL ratio GeneIn Lipofectamine Lipofectamine PolyMagNeo TransIT 1:8:8 2000, 1:3 LTX, 1:1:1 1:2 Express(*), 1:3 or Prostate(**), 1:2 4.87 ±0.06 3.80 ±0.15 0.86 ±0.12 2.4 ±0.3 1.8 ±0.4 0.33 ±0.10 0.14 ±0.05 0.10 ±0.04 3.09 ±0.07 0.25 ±0.03 0.95 ±0.02 0.47 ±0.04 0.11 ±0.03 3.5 ±0.4 0.20 ±0.03 1.65 ±0.13 0.35 ±0.13 0.23 ±0.12 2.47 ±0.07 0.01 ±0.01 0.11 ±0.04 * 0.34 ±0.06 * 0.09 ±0.05 * 1.93 ±0.10** 1.7 ±0.3 **
