Math 140 Exam 1 Review: Chapters 1-3
advertisement

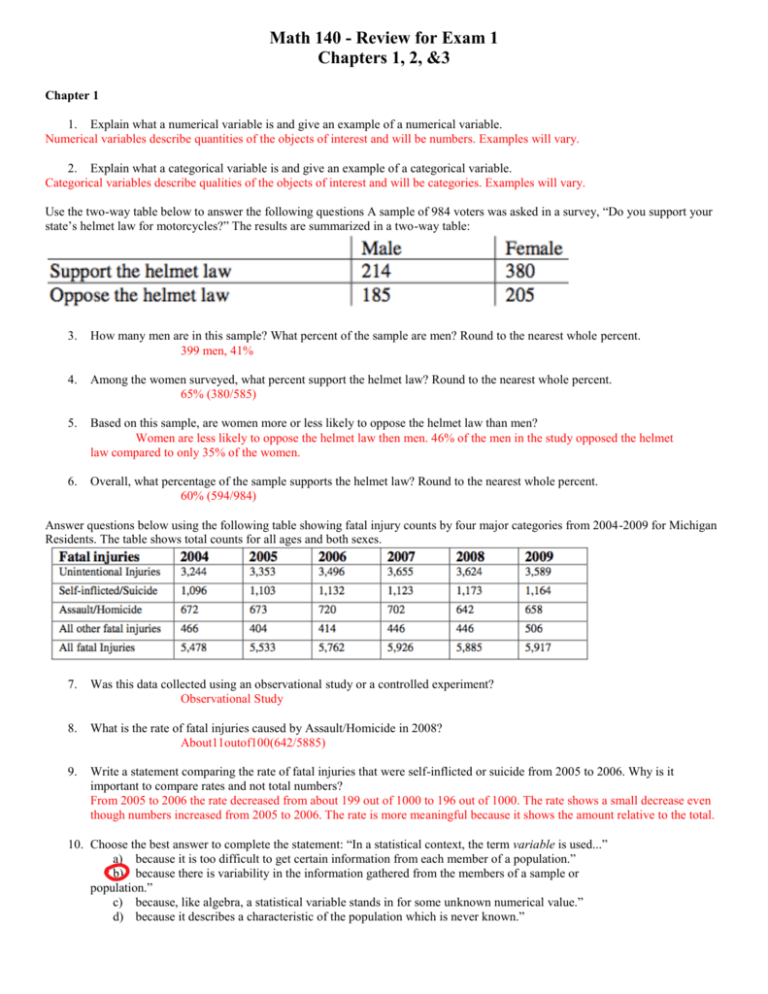
Math 140 - Review for Exam 1 Chapters 1, 2, &3 Chapter 1 1. Explain what a numerical variable is and give an example of a numerical variable. Numerical variables describe quantities of the objects of interest and will be numbers. Examples will vary. 2. Explain what a categorical variable is and give an example of a categorical variable. Categorical variables describe qualities of the objects of interest and will be categories. Examples will vary. Use the two-way table below to answer the following questions A sample of 984 voters was asked in a survey, “Do you support your state’s helmet law for motorcycles?” The results are summarized in a two-way table: 3. How many men are in this sample? What percent of the sample are men? Round to the nearest whole percent. 399 men, 41% 4. Among the women surveyed, what percent support the helmet law? Round to the nearest whole percent. 65% (380/585) 5. Based on this sample, are women more or less likely to oppose the helmet law than men? Women are less likely to oppose the helmet law then men. 46% of the men in the study opposed the helmet law compared to only 35% of the women. 6. Overall, what percentage of the sample supports the helmet law? Round to the nearest whole percent. 60% (594/984) Answer questions below using the following table showing fatal injury counts by four major categories from 2004-2009 for Michigan Residents. The table shows total counts for all ages and both sexes. 7. Was this data collected using an observational study or a controlled experiment? Observational Study 8. What is the rate of fatal injuries caused by Assault/Homicide in 2008? About11outof100(642/5885) 9. Write a statement comparing the rate of fatal injuries that were self-inflicted or suicide from 2005 to 2006. Why is it important to compare rates and not total numbers? From 2005 to 2006 the rate decreased from about 199 out of 1000 to 196 out of 1000. The rate shows a small decrease even though numbers increased from 2005 to 2006. The rate is more meaningful because it shows the amount relative to the total. 10. Choose the best answer to complete the statement: “In a statistical context, the term variable is used...” a) because it is too difficult to get certain information from each member of a population.” b) because there is variability in the information gathered from the members of a sample or population.” c) because, like algebra, a statistical variable stands in for some unknown numerical value.” d) because it describes a characteristic of the population which is never known.” 11. The average gas mileage of the top selling mini-vans for each U. S. car manufacturer is an example of what type of variable? a) Numerical variable b) Categorical variable c) Neither 12. A state senator’s comments about the dangers of global warming are an example of what type of variable? a) Numerical variable b) Categorical variable c) Neither 13. Marital status of each member of a randomly selected group of adults is an example of what type of variable? a) Numerical variable b) Categorical variable c) Neither 14. In a survey, married couples were asked, “Do you have children?” The response was electronically recorded as a “1” for yes and a “0” for no. This is an example of ____________. a) Coded categorical data b) Unstacked numerical data c) Random sample d) None of the above 15. Researches want to find out which U. S. movie has the most positive audience reaction for the current week. As they exited a randomly selected movie theater, movie-goers were asked to give the movie they had just viewed a letter grade of A, B, C, D, or F. In this scenario, the movie-goers are an example of a _____. a) Sample b) Population c) Variable 16. A two-way table is useful for summarizing and comparing what? a) A numerical variable and categorical variable that may be related. b) Two numerical variables that may be related. c) Two categorical variables that may be related. Consider the following table for questions below: The two-way table below shows teenage driver gender and whether or not the respondent had texted at least once while driving during the last thirty days. 17. What percentage of the sample had texted at least once while driving in the past thirty days? 18. What percentage of the sample were female drivers? 19. In a sample of 800 first-year college students, 72% said that they check their Facebook page at least three times a day. How many students is this? Chapter 2 – Part 1 1. Each day for twenty days a record store owner counts the number of customers who purchase an album by a certain artist. The data and a dotplot of the data are shown below: Which of the following statements can be made using the given information? a) On the first day of collecting data the record store owner had one person purchase an album by the artist. b) The dotplot shows that this data has a roughly bell-shaped distribution. c) During the twenty days when the record store owner collected data, there were some days when no one purchased an album by the artist. d) None of the above A fitness instructor measured the heart rates of the participants in a yoga class at the conclusion of the class. The data is summarized in the histogram below. There were fifteen people who participated in the class between the ages of 25 and 45. Use the histogram to answer questions below. 2. How many participants had a heart rate between 120 and 130 bpm? 3. What percentage of the participants had a heart rate greater than or equal 130 bpm? 4. Find the original data set from the stemplot given below. 5. A collection of twenty college students was asked how much cash they currently had in their possession. The data is summarized in the stemplot below. Typically, how much money does a student have in his or her possession? Match one of the following histograms with one of the descriptions in questions below: 6. The distribution of heights of adult males tends to be symmetrical which is displayed in histogram ________. 7. The distribution of the numbers of times individuals in the 18-24 age group log onto a social networking website during the course of a day tends to be right- skewed which is displayed in histogram ________. 8. The distribution of test scores for a group of adults on a written driving exam following a refresher course tends to be left-skewed which is displayed in histogram ________. 9. The histogram below shows the distribution of pass rates on a swimming test of all children who completed a four week summer swim course at the local YMCA. What is the typical pass rate for the swim test? 10. The histogram below displays the distribution of the length of time on hold, for a collection of customers, calling a repair call center. Use the histogram to select the true statement. a) The distribution is symmetrical. The number of callers who waited on hold for less than three minutes was the same as the number of callers who waited on hold for more than three minutes. b) The distribution is left-skewed and most callers waited on hold at least three minutes. c) The distribution shows that the data was highly variable with some callers waiting on hold as many as 20 minutes. d) The distribution is right-skewed and most callers waited on hold less than three minutes. 11. Based on the histogram in question above, would it be unusual to be on hold for 5 minutes or more at this call center? a) Yes, it would be unusual. b) No, it would not be unusual. c) Not enough information given. 12. Histogram shows the distribution of pitch speeds for a sample of 75 pitches for a college pitcher during one season. Which of the following statements best describes the distribution of the histogram below? 13. The histogram below is the distribution of heights for a randomly selected Boy Scout troupe. Choose the statement that is true based on information from the histogram 14. A group of junior high athletes was asked what team sport was their favorite. The data are summarized in the table below. On the pie chart, which area would correspond to the category “Soccer”? 15. Which of the following statements about bar graphs is true? a) It sometimes doesn’t matter in which order you place the bars representing different categories. b) It is appropriate to have gaps between the bars on the graph. c) On a bar graph, the width of the bars has no meaning. d) All of the above are true for bar graphs. 16. What was the most common response for 1999? a) No College b) Some College c) Graduated College, Associate’ s Degree d) Graduated College, Bachelor’ s Degree 17. All of the juniors and seniors at a college are asked their major. Which of the following graph types would be appropriate for displaying the variability in majors for this data set? a) Bar graph b) Histogram c) Stemplot d) None of the above 18. Data was collected on hand grip strength of adults. The histogram below summarizes the data. Which statement is true about the distribution of the data shown in the graph? 19. The graph below displays the number of applications for a concealed weapons permit in Montcalm County, Michigan, for each of three years. A reported interprets this graph to mean that applications in 2010 are more than twice the level in 2008. Is the reported making a correct interpretation? Chapter 2 – Part 2 Chapter 3 – Part 1 Chapter 3 – Part 2


